Solana On The Verge Of A Reversal? Technical Check – May 1, 2025
Solana shows a technical rebound, driven by renewed interest in the market. Find our complete analysis and current technical outlook for SOL.
In brief
- Technical analysis: Solana rebounds around $151, up 7% this week. Volumes rise slightly, indicating renewed interest. The long-term trend remains bullish. The 50-day moving average is neutral. A break above $141 could restart momentum.
- Technical levels: Support at $140, then $123 and $108. Resistances at $157, $180, and $205. Monthly pivot point at $133. Value area between $145 and $237.
- Derivatives analysis: Open interest climbs, signaling speculative resurgence. Price resists selling pressure, reflecting absorption. Low liquidations, neutral funding rate: stable market.
- Conclusion: Above $141, the bias remains bullish towards $205. Below, risk of pullback towards $123 or $95. Market balanced but dependent on upcoming catalysts.
Solana (SOL) Technical Analysis
| Indicator | Status | Comment |
| Spot Price | ≈ $151 | Bullish recovery, followed by consolidation below the $157 resistance. |
| Latest Weekly Changes | +7% | Significant technical rebound, consolidating the bullish momentum. |
| Latest Weekly Spot Volumes | ≈ $7.5B (+5%) | Moderate volume increase, consistent with renewed buyer interest. |
| Long-term Trend (SMA 200) | Bullish | Unchanged trend, supporting a positive long-term bias. |
| Medium-term Trend (SMA 50) | Neutral | Transition bias; above $141, a bullish recovery is plausible. |
| Short-term Trend (SMA 20) | Bullish | Bullish recovery confirmed after a phase of technical consolidation. |
| Momentum | Rebound | Recovery of bullish momentum, validated by momentum indicators (oscillators). |
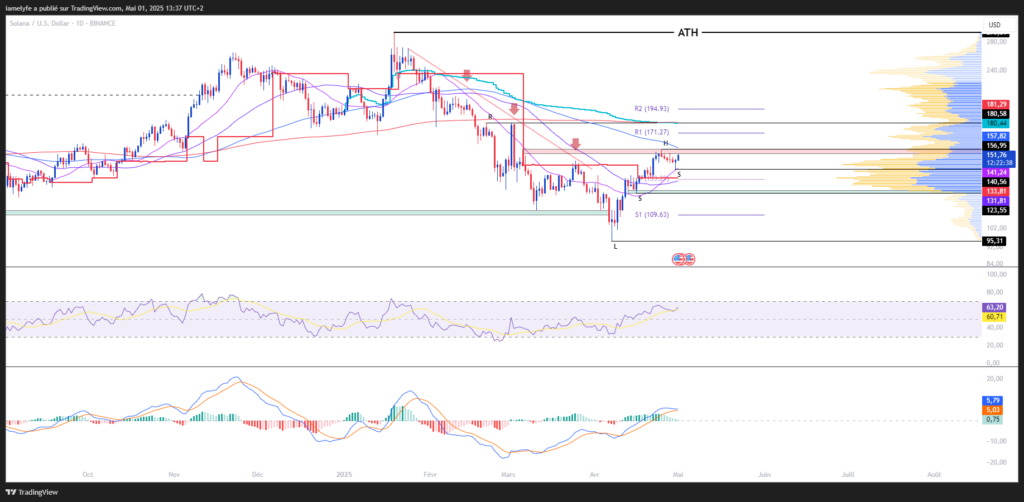
The price of Solana hovers around $151, recovering, followed by consolidation below the $157 resistance. The weekly performance of +7%, combined with a moderate rise in spot volumes (+5%), confirms a technical rebound consistent with renewed buyer interest. The long-term trend remains solidly bullish (SMA 200), while the medium term (SMA 50) remains neutral, with reversal potential above $141. In the short term, bullish momentum is reaffirmed (SMA 20). Momentum is recovering, supported by oscillators.
Solana (SOL) Technical Levels
| Indicator | Status | Comment |
| Resistances | $157 / $180 / $205 | Potential distribution zones; exceeding these levels could open the way for bullish extension. |
| Supports | $140 / $123 / $108 | Historical demand zones; breaching these could expose the risk of further decline. |
| Monthly Pivot Point | $133 | Reference level for the monthly trend. |
| Upper Value Area | $237 | High volume area; upper limit of market balance, beyond which imbalance may arise. |
| Lower Value Area | $145 | High volume area; lower limit of market balance, beyond which imbalance may arise. |
SOL is currently trading around $151, close to the lower value area ($145), indicating a return to a market equilibrium zone. The monthly pivot point at $133 serves as a reference for the month’s bias. Supports at $140, $123 & $108 are key demand zones; their break would reinforce a bearish risk. On the upside, resistances at $157, $180, and $205 mark distribution levels whose breakthrough would validate continued bullishness. The upper value area, located at $237, constitutes a significant structural resistance.
Market Sentiment
| Indicator | Status | Comment |
| Market Sentiment (Fear & Greed Index) | Neutral | Stabilized sentiment, reflecting a rebalancing of expectations and a gradual return of risk appetite. |
Market sentiment has stabilized, reflecting a more balanced environment. This return to neutrality, combined with increased risk appetite, favors tactical positioning in a context of gradual recovery.
The current technical analysis was carried out in collaboration with Elyfe and 0xhugzer, investors and educators in the cryptocurrency market.
Derivatives Analysis (SOL/USDT)
| Indicator | Status | Comment |
| Open interest | Rising | Clear recovery of exposure, speculative engagement increasing. |
| CVD | Sell-side absorption | CVD decreasing, price rising: market sellers absorbed on the bid, persistent passive buying pressure. |
| Liquidation | Low, no bias | Very low liquidation activity. No significant forced unwinding. |
| Funding rate | Neutral | Moderate long positioning; no extreme imbalance or overheating. |
The market shows a clear recovery in speculative engagement with rising open interest, while price advances despite market sellers dominance (CVD declining), indicating active absorption on the bid; liquidations remain low and funding is neutral, reinforcing a clean technical environment conducive to continuation of the initiated move.

| Indicator | Status | Comment |
| Sell-side liquidation zone | ≈ $183 / $192 | Order concentration zone; reaching these levels could trigger volatility acceleration. |
| Buy-side liquidation zone | ≈ $140, $115 | Order concentration zone; reaching these levels could trigger volatility acceleration. |
Sell-side liquidation zones at $183, $192 can trigger bullish accelerations if breached, but also represent zones prone to distribution if the market shows signs of fatigue. On the buy side, the $140 and $115 thresholds face flush risk if broken, but also offer absorption or institutional accumulation opportunities for medium-term repositioning.

Forecasts for Solana (SOL) Price
Bullish Scenario:
- Conditions: Maintenance above $141.
- Targets: $157 / $180 / $205 – $210 and beyond.
- Potential: About +38% from the current level.
Bearish Scenario:
- Conditions: Break of support at $141.
- Targets: $132 / $123 / $108 – $101 / $95.
- Potential: Decline up to -37%.
Comment:
The bias remains neutral to bullish as long as SOL price holds above the $141 zone, a key level of the short-term range. The next FOMC meeting and its monetary policy decision could be decisive to validate this scenario.
Conclusion
Solana shows signs of reversal, with a rebound supported by renewed interest and bullish momentum rebuilding. The selling flow remains absorbed, reflecting a discreet but solid buyer presence. The market remains balanced, without excessive tension, in an environment more favorable for tactical positioning, subject to the market’s reaction to upcoming macroeconomic catalysts. In this context, it will be essential to closely monitor price reactions at strategic levels to confirm or adjust current forecasts.
Finally, let us recall that these analyses are based solely on technical criteria, and cryptocurrency prices can quickly change due to other more fundamental factors.
Did you find this study interesting? Find our latest Ethereum analysis.
Maximize your Cointribune experience with our "Read to Earn" program! For every article you read, earn points and access exclusive rewards. Sign up now and start earning benefits.

Spécialiste en analyse technique, Elyfe décrypte les tendances graphiques des marchés des cryptomonnaies avec une approche rigoureuse et en constante évolution. À travers ses analyses détaillées, il apporte un regard éclairé sur la dynamique des prix, aidant les investisseurs et passionnés à mieux comprendre et anticiper les mouvements du marché.
The contents and products mentioned on this page are in no way approved by Cointribune and should not be interpreted as falling under its responsibility.
Cointribune strives to communicate all useful information to readers, but cannot guarantee its accuracy and completeness. We invite readers to do their research before taking any action related to the company and to take full responsibility for their decisions. This article should not be considered as investment advice, an offer, or an invitation to purchase any products or services.
Investment in digital financial assets carries risks.
Read more