Chainlink Reaches a Record Number of Holders as the Market Awaits a Recovery Signal
The digital asset ecosystem continues to evolve despite a still hesitant altcoin market. In this context, Chainlink reports a significant increase in its adoption with an unprecedented number of Ethereum wallets holding LINK tokens. This dynamic contrasts with more cautious activity in the derivatives markets, where sellers maintain the advantage. While long-term investors continue their accumulations, market indicators draw a fragile balance between fundamental confidence and expectations of a more marked movement.

In brief
- Chainlink surpasses for the first time 900,000 non-empty Ethereum wallets holding LINK.
- The network gained more than 20,000 new holders in one month, despite a still fragile altcoin market.
- Long-term investors continue their accumulations, while derivatives traders remain mostly sellers.
- LINK trades around $8.16 and faces a significant technical resistance located at $8.18.
- Liquidity zones between $8.00 and $8.30, as well as the $7.75 support, could guide the market’s next move.
hainlink Passes the Historic Milestone of 900,000 Holders
Chainlink has just reached an unprecedented high by crossing the threshold of 900,000 non-empty Ethereum wallets holding LINK, a level never seen before. According to Sentiment Intelligence data, the network welcomed over 20,000 new holders during the last month. This increase comes however in an environment where the entire altcoin market remains under pressure.
This evolution highlights a steady accumulation rather than a resurgence of speculative buys. Investors continued to acquire tokens while prices remained well below previous peaks. This behavior reflects lasting confidence in the project despite a period of market uncertainty.
At the same time, the expansion of the user base strengthens Chainlink’s role in several major blockchain ecosystem sectors. The protocol maintains a central position for infrastructures related to decentralized finance, tokenized assets, and cross-chain exchanges. Even though this adoption has not triggered an immediate price increase, it consolidates the network’s fundamentals in the long term.
Investors Accumulate While Derivatives Markets Remain Cautious
Despite this record adoption, leveraged markets show a very different read. Derivatives traders continue to take a cautious approach, which currently limits the impact of this growth on Chainlink’s price.
The CVD (Cumulative Volume Delta) of futures takers over 90 days remains dominated by sellers as shown by the CryptoQuant chart data below. Aggressive sell orders still exceed market buys. This configuration illustrates a marked gap between investors building long positions and operators focused on short-term moves.
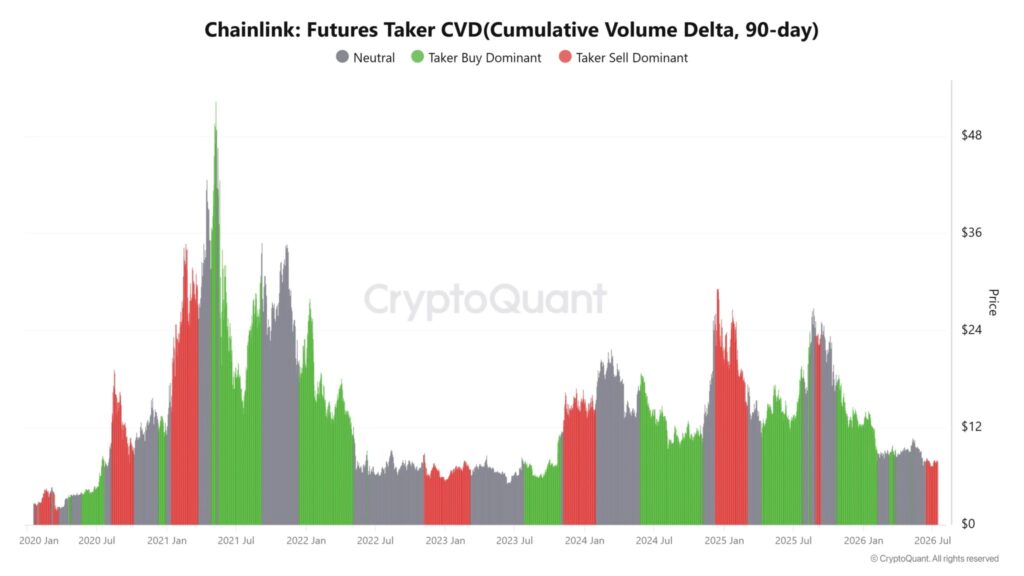
Holders continue their purchases while leveraged players seem to await further confirmations before increasing their exposure. This caution suggests that a consolidation phase remains possible before a potential market acceleration.
Meanwhile, selling pressure has not prevented the number of holders from continuing to increase. This development shows that Chainlink’s adoption follows a trajectory independent of the fluctuations seen in derivatives markets. As long as buyers do not regain control of order flows, the progression potential of LINK could, however, remain limited.
LINK Rebounds on Its Support but Remains Blocked Under Major Resistance
At the time of writing, the LINK price oscillates around $8.16 after a rebound on a major technical support, reflecting gradual improvement in momentum. Despite this recovery, the price faces significant resistance that must be overcome to confirm a stronger rebound.
Here are the key technical levels explaining the token’s current evolution:
- The $7.00 support allowed the price to stop its decline and begin a recovery.
- The resistance at $8.18 is the main obstacle to continuing the rise.
- Breaking this resistance could open the way to $9.00, an important psychological threshold.
- The Relative Strength Index (RSI) reaches 52.51, signaling a gradual return of buying pressure.
- The RSI moving average stands at 50.44, confirming a progressively improving momentum.
Technical indicators thus show that buyers are gradually taking control. After the oversold conditions observed in June, the market finds better balance without entering an overbought situation.
Price structure also confirms this evolution. Since its rebound, LINK records higher lows, reflecting progressively stronger demand. Buyers are therefore taking the initiative, but without a sharp move.
Breaking the resistance would be an important technical signal to confirm the recovery. Conversely, a new failure below this level would prolong the consolidation phase observed for several sessions.
Liquidity Zones Could Guide the Next Market Move
The Binance liquidation heatmap data below highlight several levels likely to influence the market’s next move. Several significant liquidity concentrations appear above the current price, notably between $8.00 and $8.30, extending up to $8.31.
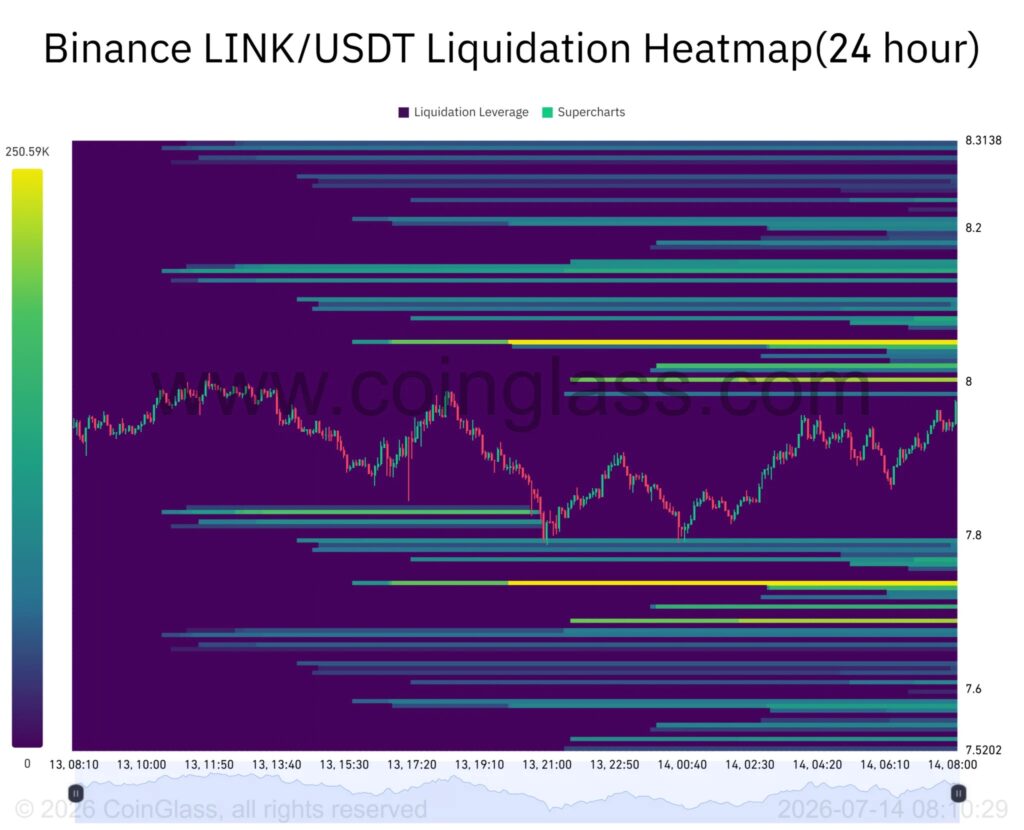
These levels often attract price movements as many leveraged positions become vulnerable in these areas. When liquidations trigger, they can accelerate volatility and amplify ongoing movements.
Below the market, another liquidity concentration lies around $7.75. This zone could play an important role if sellers regain the advantage. LINK currently trades between these two poles, reflecting a temporary balance between buying and selling forces.
Operators generally watch these levels closely, as prices tend to converge towards the zones with the most liquidity. A sustained break above $8.00 could trigger short-position liquidations and boost buying. Conversely, a break below $7.75 would open the way to a new bearish pressure phase for Chainlink.
The continuous rise in holders remains a fundamental positive for Chainlink, even if derivatives markets stay cautious. The coming days’ evolution will mainly depend on buyers’ ability to break the $8.18 resistance while absorbing selling pressure. If this balance shifts in favor of demand, the token’s adoption momentum observed in recent weeks might gradually be reflected in LINK’s price evolution.
Maximize your Cointribune experience with our "Read to Earn" program! For every article you read, earn points and access exclusive rewards. Sign up now and start earning benefits.

Journaliste et rédacteur web passionné par l’univers des cryptomonnaies et des technologies Web3. J’y traite les dernières tendances et actualités afin de proposer un contenu de haute qualité à un large public du secteur.
The views, thoughts, and opinions expressed in this article belong solely to the author, and should not be taken as investment advice. Do your own research before taking any investment decisions.