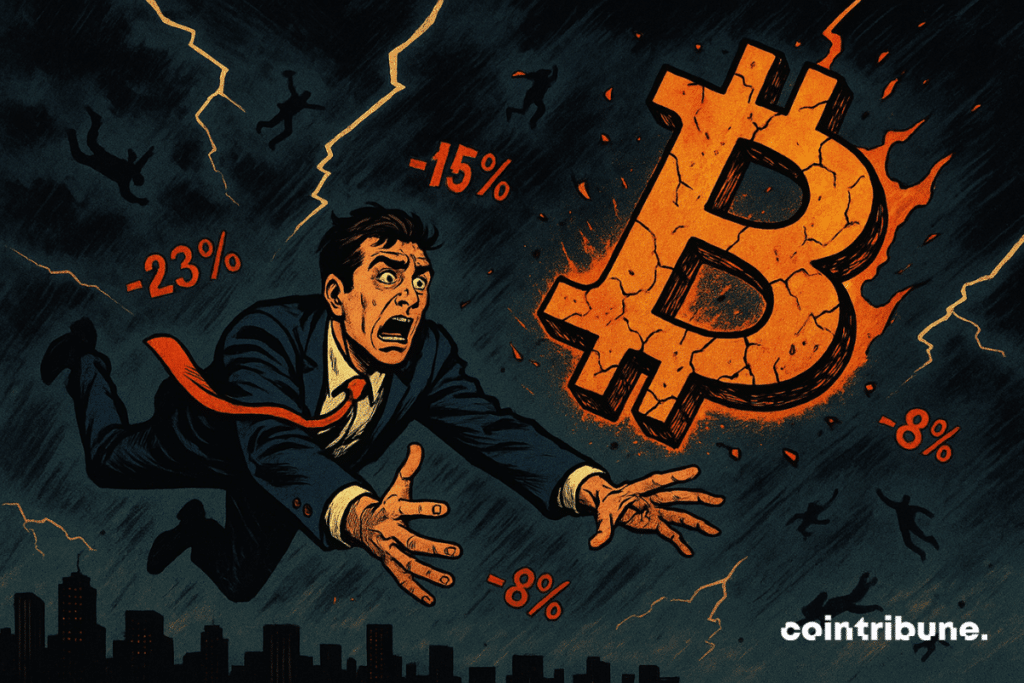
Bitcoin Enters Recalibration Phase Amid Investor Caution
After months of recovery, the bullish momentum of the bitcoin market is abruptly fading. All indicators, spot, derivatives, ETFs, turn red, revealing a drop in liquidity, a decline in risk appetite, and a general slowdown. The latest Glassnode report confirms a phase change : euphoria gives way to caution, in a fragile and unpredictable market context.

In brief
- The Bitcoin market is undergoing a notable pause after a bullish first half of the year.
- Glassnode report data show a widespread decline in momentum.
- The spot market shows worrying technical signals, with RSI in the oversold zone.
- The drop in volumes, financing, and inflows suggests increased market caution.
A widespread decline in spot, derivatives and Bitcoin ETF markets
The bitcoin market is currently going through an unstable period with massive sales and discreet buying. In its latest report, Glassnode notes a clear inflection in bitcoin’s bullish momentum, signaling that “momentum is dissipating in spot, futures, options and ETF markets”.
In the spot market, indicators show a rapid deterioration of the technical structure. The RSI (Relative Strength Index) has dropped from 47.4 to 35.8, crossing the lower threshold and entering the oversold zone.
This correction is accompanied by a marked strengthening of selling pressure. The spot CVD (Cumulative Volume Delta), a key indicator of imbalance between buy and sell orders, collapses from -107.1 million $ to -220 million $, while liquidity weakens, as evidenced by a drop in daily volume from 8.4 to 7.5 billion $. This trio of indicators suggests a loss of buying momentum and a more active distribution phase.
The phenomenon extends to derivatives and ETF markets, reinforcing the idea of a decline in risk appetite across the market. Figures published by Glassnode reveal a cautious dynamic :
- Open Interest on futures contracts slightly declines from 45.6 to 44.9 billion $, indicating a partial disengagement from open positions ;
- Long position financing falls by 33 %, settling at 3.1 million $, indicating a retreat of leveraged bullish demand ;
- CVD on perpetual contracts slides from -1.2 to -1.8 billion $, signaling persistent selling pressure ;
- Open Interest on options declines by 8.4 % to 39.8 billion $, reflecting a progressive disinterest in speculative bets ;
- Implied volatility (volatility spread) contracts sharply, dropping from 23.84 % to 16.26 %, signaling a risk reassessment by investors ;
- The 25 Delta Skew rises to 5.51, exceeding its upper band, showing increased interest in bearish protection options ;
- Net inflows into ETFs fall by 24.9 % to 269.4 million $, well below recent average levels ;
- ETF transaction volume increases slightly by 9.9 % to 19.8 billion $, a sign of a reactive but defensive market ;
- ETF MVRV ratio decreases from 2.4 to 2.3, indicating a slight retreat in average position profitability.
This coordinated decline across several market segments illustrates a shift toward caution. While no abrupt collapse is observed at this stage, the synchronization of negative signals confirms a disengagement phase.
A more measured on-chain activity and signs of seller exhaustion
Beyond traditional financial markets, on-chain activity offers a more contrasted reading of the situation. While the environment remains generally less active, some metrics reveal a certain balance in market structure.
The number of active addresses increases by 3.6 % to reach 729,000, while the Realized Cap Change metric remains high at 6.3 %, indicating that capital flows continue to arrive on the network, albeit at a slower pace.
In contrast, transferred volume falls by 13.9 % to 9.4 billion dollars, and transaction fees decrease by 14.4 % to 483,200 dollars, signs of more discreet on-chain economic activity.
From a liquidity and capital distribution perspective, indicators remain stable. The Short-Term Holders / Long-Term Holders ratio is unchanged at 17.3 %, and the speculative capital share (Hot Capital Share) remains at 36 %, reflecting a relative balance between short and long-term investors.
On the other hand, on-chain profitability data reflect increasing caution. The percentage of supply in profit declines to 93.6 %, NUPL falls to 8.6 %, and the Realized Losses/Profits ratio drops to 1.9. These elements show that, despite a still generally profitable market, profit expectations are more reserved.
According to Glassnode, the market appears to be sliding from a phase of euphoria towards a phase of reassessment, with oversold conditions and signs of seller exhaustion that could suggest a short-term technical rebound. However, the overall market structure remains fragile, making any recovery scenario dependent on an external catalyst or renewed demand, still uncertain at this stage. If a rebound is possible, it rests on weak foundations, inviting caution in projections. In this perspective, can bitcoin still target $148,000 before the end of the year ?
Maximize your Cointribune experience with our "Read to Earn" program! For every article you read, earn points and access exclusive rewards. Sign up now and start earning benefits.
Diplômé de Sciences Po Toulouse et titulaire d'une certification consultant blockchain délivrée par Alyra, j'ai rejoint l'aventure Cointribune en 2019. Convaincu du potentiel de la blockchain pour transformer de nombreux secteurs de l'économie, j'ai pris l'engagement de sensibiliser et d'informer le grand public sur cet écosystème en constante évolution. Mon objectif est de permettre à chacun de mieux comprendre la blockchain et de saisir les opportunités qu'elle offre. Je m'efforce chaque jour de fournir une analyse objective de l'actualité, de décrypter les tendances du marché, de relayer les dernières innovations technologiques et de mettre en perspective les enjeux économiques et sociétaux de cette révolution en marche.
The views, thoughts, and opinions expressed in this article belong solely to the author, and should not be taken as investment advice. Do your own research before taking any investment decisions.