Will Ethereum Fall Below $2,000 Amid Unprecedented Influx?
Dreams are crumbling. Ethereum’s trajectory, long praised, is now dangerously faltering. While a surge towards $3,000 seemed within reach, the wind has turned. Technical indicators darken, supports give way, and the specter of a plunge into the abyss looms. Yet, at the same time, contradictory signals emerge. Ether falls, but funds flow in. A paradox that intrigues as much as it confounds.

In Brief
- Ethereum falls to $2,510, rejected below $2,550, hinting at a potential crash to $1,750.
- Despite the decline, $2 billion in crypto inflows have been recorded over eight consecutive weeks.
- Institutions like Robinhood tokenize on Arbitrum, signaling a strategic pivot towards Ethereum.
- The $2,226 level remains defended, but the threat of a technical breakdown strongly persists.
Ethereum Decline: Red Alert on the Charts, Hope Buried?
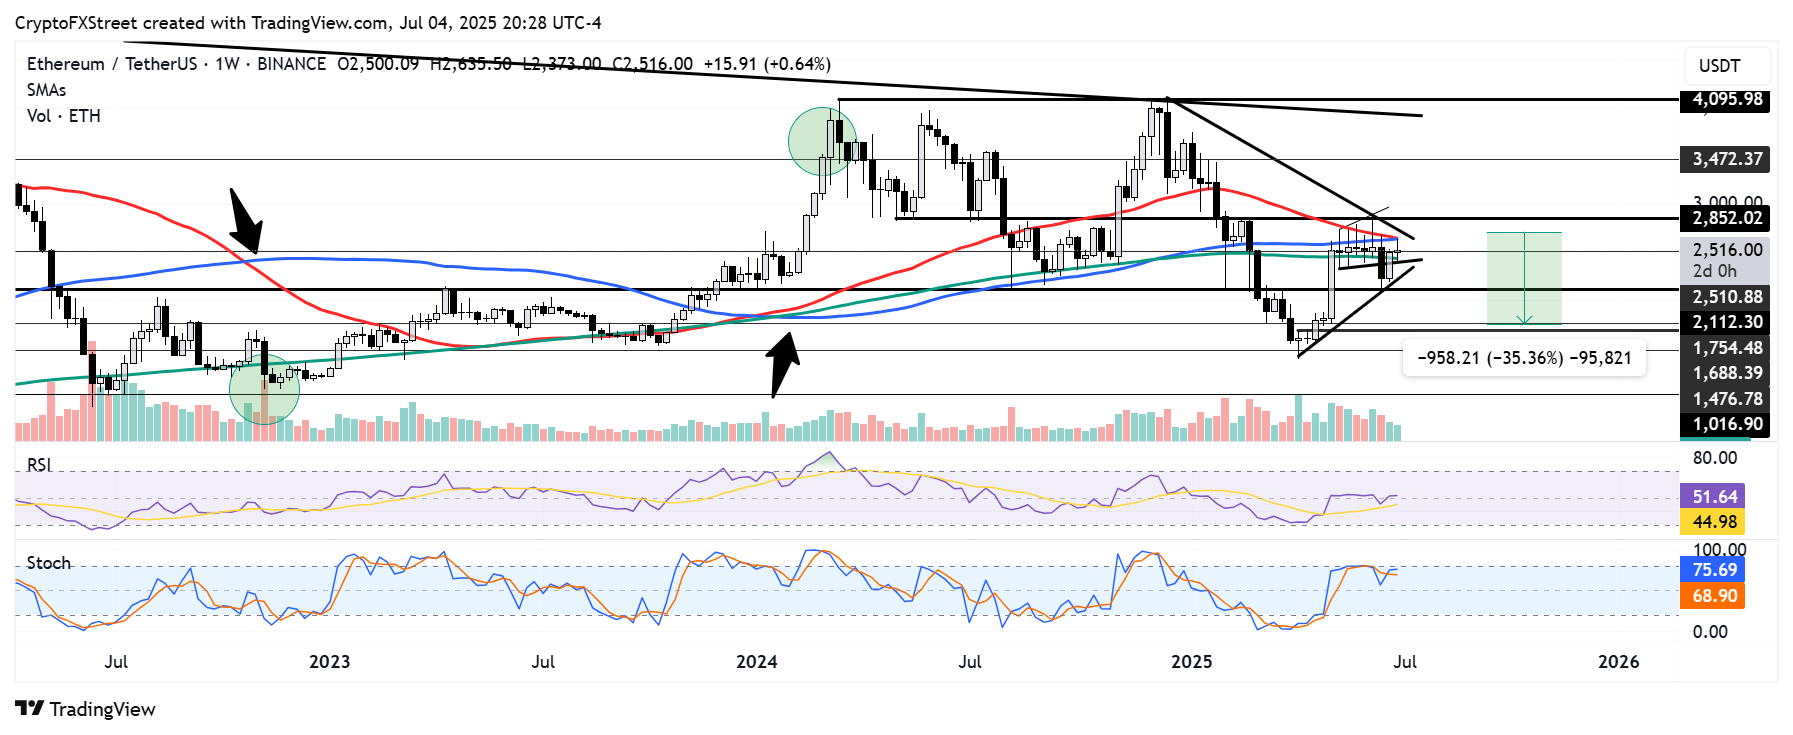
Ethereum is navigating blindly. On Friday, the ETH price fell to $2,510, down 3%. And this is not just a simple pullback. Several rejection candles below $2,550 mark a technical breakdown. Analysts see this as a “bull trap”, a false bullish breakout that traps the optimists.

Meanwhile, moving averages are sliding towards a death cross. If the 50 SMA crosses below the 100 SMA, a drop to $1,750 becomes plausible. In the last two instances of this crossover, ETH experienced moves greater than 35%, FXStreet notes. In other words, history clearly favors a significant move.
Liquidations are surging: $56.82 million evaporated in 24 hours. Long positions, which bet on the rise, were the hardest hit. RSI remains neutral. MACD weakens. Volumes are shrinking. Indicators are flashing orange.
But amid this dark picture, some detect a divergence. A tweet from Merlijn The Trader suggests it:
Ethereum is quietly breaking records again. Daily $ETH transactions are approaching ATH levels. No meme mania. No gas fee spikes. Just steady, unstoppable usage.
Crypto and Institutional: The Strange Marriage Supporting Ethereum
While technical signals turn red, a green tide flows behind the scenes: inflows into Ethereum ETFs. In eight weeks, nearly $2 billion has flowed in. On July 3, an additional $148 million was added. A discreet but massive influx, driven by institutional players.
Robinhood has launched the tokenization of 200 US stocks on Arbitrum, a Layer 2 solution of Ethereum. A symbolic turning point. Other players are following. BitMine is abandoning bitcoin mining to adopt a treasury strategy based on ether. SharpLink Gaming now holds the largest publicly traded share of ETH.
For Bitwise’s CIO, Matt Hougan, this is just the beginning: projections estimate over $10 billion in inflows in the second half of 2025. Ethereum thus establishes itself as the foundation of a tokenized crypto-economy.
And what if the current drop is just a disguise? A disguise under which institutions are patiently accumulating?
ETH: War Zone Between $2,226 and $2,535 – Who Will Yield?
The fate of ether is playing out in a narrow corridor. Between $2,226, a magnetic support, and $2,535, an impassable ceiling, traders clash with Japanese candlesticks and limit orders.
A breakout above $2,535 would reinvigorate the bulls. Immediate targets: $2,600, $2,732, then $2,800. Conversely, a break below $2,400 would trigger a plunge to $2,226, or even lower.
Some key figures to remember:
- Over $2 billion injected into Ethereum ETFs in 8 weeks;
- $56.82 million positions liquidated in 24 hours;
- The $2,226 support acted as an anchor point 3 times in 30 days;
- The RSI oscillates at 45.9 on the 4-hour chart;
- ETH/BTC has broken out of its descending channel, signaling a rotation towards Ethereum.
In the background, a daily chart shaped like a bullish flag remains active. If ether breaks $2,650, a projection towards $4,300 to $4,500 is triggered.
This consolidation might therefore just be a pause. An accumulation point, waiting for a fresh breath.
The verdict remains pending. While some predict a relaunch towards $1,750, others dare to see further. A recent study even imagines an Ethereum at $706,000, citing mass adoption, exponential institutional flows, and programmed scarcity. Between promise and precipice, ether plays all or nothing.
Maximize your Cointribune experience with our "Read to Earn" program! For every article you read, earn points and access exclusive rewards. Sign up now and start earning benefits.
La révolution blockchain et crypto est en marche ! Et le jour où les impacts se feront ressentir sur l’économie la plus vulnérable de ce Monde, contre toute espérance, je dirai que j’y étais pour quelque chose
The views, thoughts, and opinions expressed in this article belong solely to the author, and should not be taken as investment advice. Do your own research before taking any investment decisions.