Before You Buy That Conference Sponsorship, Read This Data First
Do crypto conferences actually drive traffic? We ran the stats so you don’t have to.

Key takeaways
- US crypto media outlets see only a 0.2% traffic bump during conference months.
- At the same time, Asian crypto publishers see a 4.5% traffic spike, but nearly all of it comes from 27 Southeast Asian sites in October 2025 (when Bitcoin hit its cycle top and crypto recorded its largest single-day liquidation a week later).
- The readers showing up around conference weeks are following the Bitcoin price, which rallies +6.61% in the 30 days before a Tier-1 event.
- Once you control what Bitcoin is doing, conference sponsorship is mostly paying for a price move that would have arrived with or without the lanyards.
Crypto traffic tracks Bitcoin. When BTC rallies, readers pour into crypto outlets, and when it bleeds, they wander off. That is the background against which every sponsorship decision gets made.
A publisher tells you a conference month drove a 20% lift, and you nod, but the real question is whether the conference did the work or whether Bitcoin just happened to rally through the weeks the event was running (if you cannot tell the two apart, you are paying conference money for a price move you would have gotten anyway).
To answer that question, we pulled monthly visit data for 274 crypto and Web3 outlets across Asia and the United States, the two regions that host most Tier-1 conferences, from January 2025 through March 2026.
Before the results, here is a short glossary of the symbols and column headers in the tables and figures:
- z-score: how unusual one month was for a website. Think of it like a “weirdness score” against that website’s normal pattern. Zero means a totally typical month, +1.5 (a “surge”) means much higher than normal, and −1 means worse than normal.
- σ (sigma): the size of a “normal” jump up or down. Z-scores are expressed in sigmas, so +1.5 σ just means “one and a half normal-size jumps above the average.”
- n: how many things we measured. n = 73 means seventy three conferences, or seventy three outlets, depending on the chart.
- 95% CI: short for 95% Confidence Interval. It is the range where we are 95% sure the real answer sits.
- p-value: the chance the result is just luck, on a 0 to 1 scale. The closer to 0, the more real the result; the closer to 1, the more likely it is just a coincidence.
- t-statistic: how strong a signal is compared to how noisy the data is. The closer to 0, the weaker the signal; the further from 0 in either direction, the stronger. By convention, anything past ±2 counts as real.
- std error: a measure of how much an estimate is expected to fluctuate across repeated samples. Smaller values indicate greater precision around the reported average.
- pct: short for percentile, showing the position of a value within a distribution relative to all other observations; for example, the 90th percentile means a result is higher than 90% of the dataset.
What the per-outlet test actually shows
For each outlet in our dataset, we normalized every month against that outlet’s own history (z-score against its own mean and standard deviation). In other words, we used an outlet’s usual traffic as the yardstick, so a small website was not unfairly compared against a giant one.
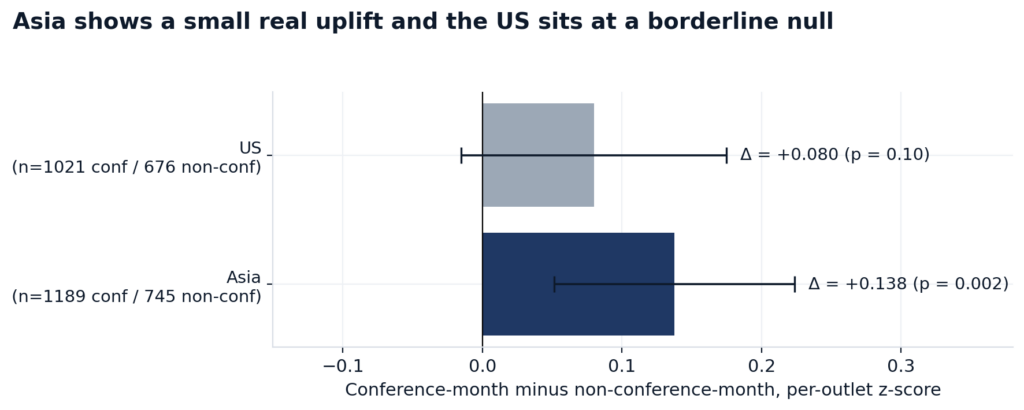
We then conducted one-sample t-tests on conference-month z-scores against a null hypothesis of zero mean, and two-sample t-tests comparing conference months against the rest. Put simply, we tested whether traffic during conference months was higher or lower than usual, and how it differed from non-conference months.
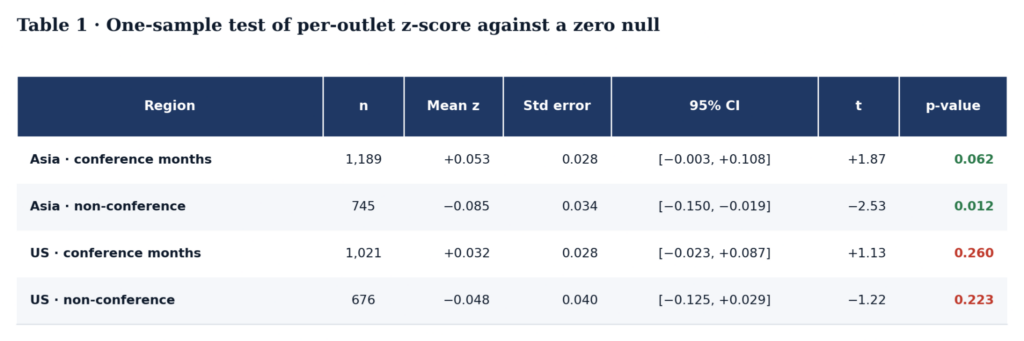
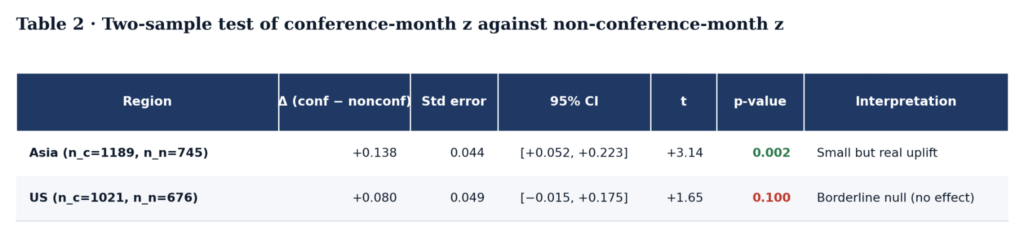
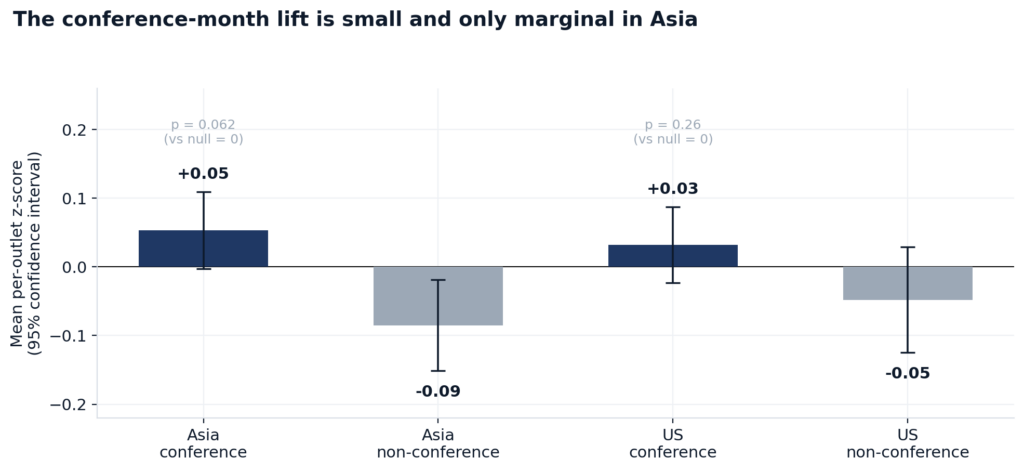
For Asian outlets, conference months ran 1% above each outlet’s yearly average. Compared only against the quiet months with no conference, the gap grew to 4.5%.
For US outlets, both comparisons turn up almost nothing: 0.2% above the yearly average, 1.5% above quiet months. Whatever conferences are doing for US publisher traffic, it is too small to detect.
To picture what those percentages mean for a real publisher, the median Asian crypto outlet in our panel pulls about 69,700 visits a month and tends to swing by around 22,300 visits one way or the other in a normal month. The 4.5% conference-month bump on that baseline is roughly 3,100 extra visits. On a smaller outlet running about 10,000 visits a month, the same lift is about 700 extra visits, which works out to 7% of traffic. On a larger one running about 480,000 visits a month, it is about 21,000 extra visits.
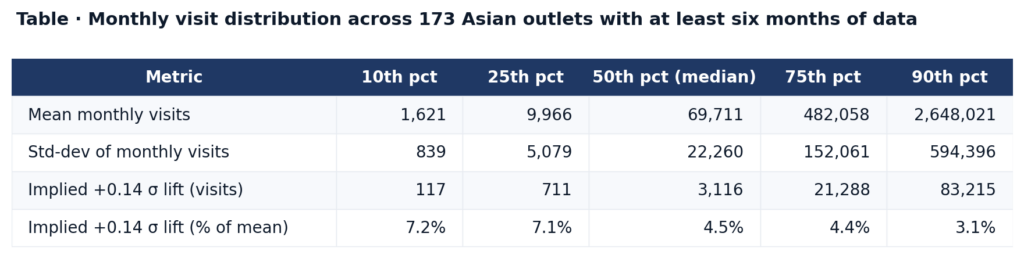
The takeaway: A conference sponsorship buyer pricing off those numbers should expect a single-digit percentage bump at a typical Asian outlet, and basically nothing at a US one.
Bitcoin runs +6.6% into every conference and then does nothing for 5 days
Now, back to the price question, because that is the reason we ran any of this in the first place. If Bitcoin is the real driver of crypto traffic, then a conference-month lift might just be a BTC-rally lift wearing a lanyard.
The right check is what Bitcoin itself does around conferences. We took 12 years of BTC daily data and 74 Tier-1 conferences and computed returns across 13 windows around each event.
The pre-event leg is the part that surprises people. BTC averages +6.61% in the 30 days leading up to a Tier-1 conference, and it goes up rather than down about 62% of the time. Something systematic pulls the price up before the lights come on.
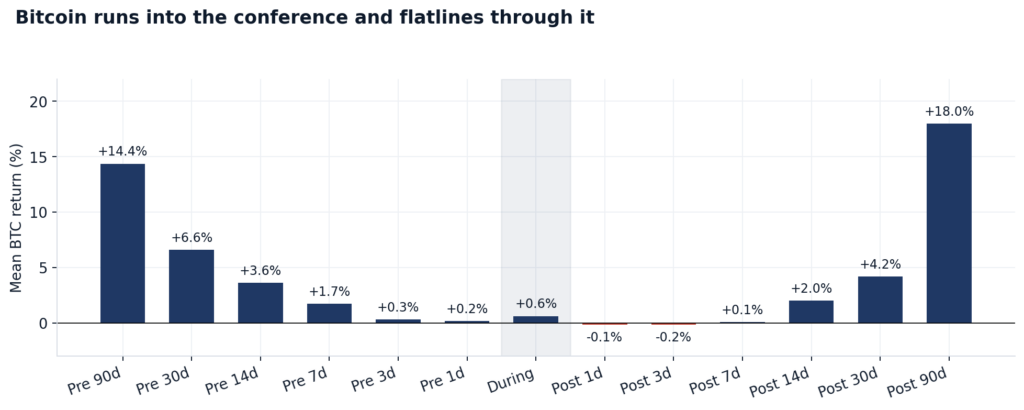
What the price does during the conference itself is a separate question and a more important one, because that is the window an attendee and a sponsor are actually paying for.
Comparing those 74 conferences against 10,000 randomly drawn windows of matching duration from the BTC price series, Bitcoin returned +0.63% on average during actual events. A typical random window returned +1.80%, with 95% of draws landing between –0.72% and +6.85%. The conference figure falls comfortably inside that range, and lands near the midpoint, while roughly half of all random windows end up at least as far from the random average as the conference number did.
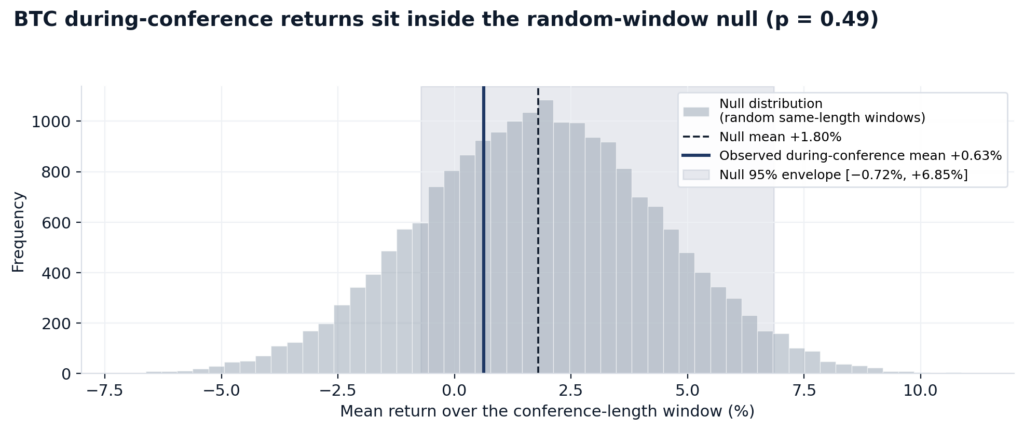
Calling that a flatline would be wrong. BTC moves during conferences, and the moves are noisy, but they are statistically indistinguishable from a random window of the same length.
The takeaway: Bitcoin rallies into the event and then behaves like any other stretch of time once the speakers take the stage.
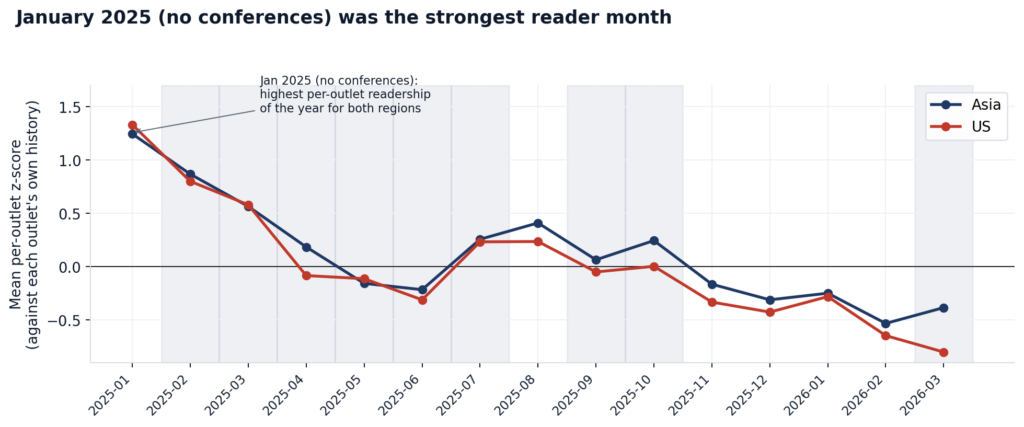
The two biggest attention months of 2025 both fell outside the conference schedule
When you zoom out, both regions hit their highest readership of the entire 15-month panel in January 2025, a month with no conferences running at all. Asia fades through most of the conference-heavy middle of the year. The US sits at or below its own quiet-month average for almost every conference month from April through August. Once the panel extends into 2026, the US stays below average across January, February, and March.
The same point shows up when you count how many outlets are simultaneously having unusually big months. For each month in each region, we tagged the outlets whose traffic was clearly above their own average, then counted what share of the panel that was.
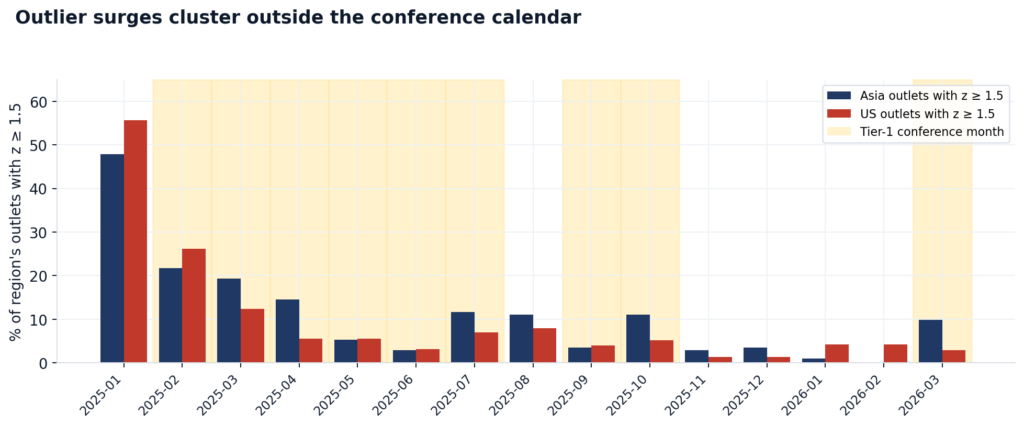
- The two biggest standout months in the whole panel are January and August 2025, and neither carries a Tier-1 conference.
- April 2025, which hosts Paris Blockchain Week and TOKEN2049 Dubai, only pulls 14.5% of Asian outlets and 5.6% of US outlets over the line.
- March 2026, the one Tier-1 conference month in Q1 2026, lands at 9.8% in Asia and 2.8% in the US.
- A conference-free January 2025, by comparison, put 47.8% of Asian outlets and 55.7% of US outlets over the same bar.
The takeaway: the biggest reader months of the year were months with no conferences running at all.
The October 2025 cluster and why it may not mean much
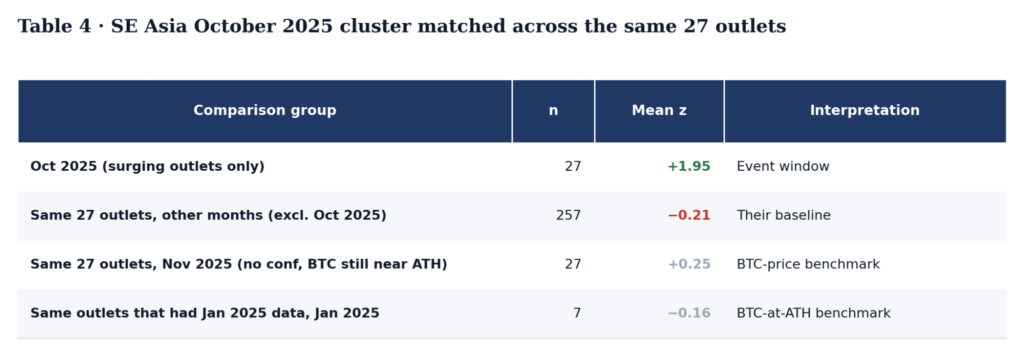
There is one cluster in the data that breaks the pattern: 27 outlets across Indonesia, Vietnam, Thailand, the Philippines, Taiwan, and small-circulation Korea surged in October 2025, the month TOKEN2049 Singapore was running.
For each of those outlets, we compared October 2025 against every other month of the panel. October came in roughly twice as high as those outlets’ own typical month, by a margin so large that the odds of it happening by accident are essentially zero.
And yet the better question is what caused it, not whether it happened.
Bitcoin topped for the cycle at roughly $126,200 in early October, the highest print of the entire bull run. On October 10, the market went through the largest single-day liquidation event in the history of crypto, with many billions of dollars of leveraged positions wiped out in a matter of minutes.
News-hungry readers swarm crypto publishers in moments like those. A surge in 27 small Southeast Asian outlets in that specific October cannot be cleanly attributed to TOKEN2049 Singapore when an all-time high print and a historic crash fell in the same weeks. The conference, the top, and the liquidation all collapse into one observation, and the data cannot tell the three apart.
We did try to isolate the conference piece by holding Bitcoin roughly constant.
We re-ran the same 27 outlets in November 2025, when Bitcoin was still near its all-time high, but no Tier-1 conference was running. Their average score collapsed to about a tenth of what October delivered. We also pulled the subset that had data going back to January 2025, another month where Bitcoin was near an all-time high, and no conference was running. Their average score there came in slightly negative.
Those two checks rule out a generic “Bitcoin was high” explanation, but they cannot separate the TOKEN2049 effect from the 10/10 liquidation effect, because those two landed in the same weeks.
The takeaway: the one big conference-month traffic surge in the data also coincided with Bitcoin’s cycle top and the largest liquidation event in crypto history, so the conference cannot fairly claim credit for it.
Why ten more Bitcoin Conferences would not settle the argument, and what actually would
But then, if price is doing most of the work, are some conference families more price-sensitive than others? Maybe Bitcoin Conference audiences react harder to drawdowns than Devcon audiences do. Maybe ETHDenver pulls traffic regardless of what BTC is doing that week.
So we built the regression. Each conference window became one observation, the 30-day Bitcoin return around it became the main input, and we added a separate adjustment for each conference family so they could have their own sensitivity to price. We fit it on the 74 events with clean BTC matches.
The model explained about 10% of the variation in post-conference traffic. An R-squared of 0.10 means, in plain terms, that the model is not picking anything up.
Which is not the same as saying there is nothing there. The Bitcoin Conference family shows a post-30-day mean of –10.9%, the worst of any cluster in the table below.
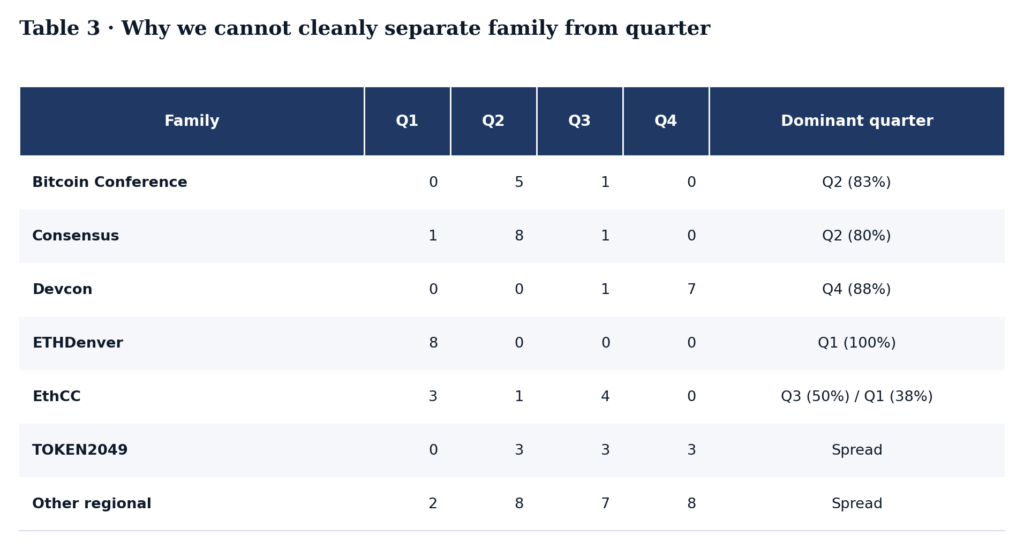
The temptation is to read that as Bitcoin Conference audiences hate drawdowns. But the Bitcoin Conference has happened 6 times in our window, and 5 of those 6 fell in Q2. ETHDenver showed up 8 times, and all 8 were in Q1. Devcon, 7 of 8 in Q4.
So is the –10.9% about the Bitcoin Conference audience, or about Q2 being a tough traffic quarter, or about what BTC happened to be doing in the springs of those particular years? The data cannot tell them apart. Each family is pinned to a quarter by the organizers’ calendar, and the family column and the quarter column carry almost the same information.
To really separate the audience signal from the season signal, we would need a world where the Bitcoin Conference had also happened a few times in Q1 and a few times in Q4. That world does not exist. Organizers pick their dates for good reasons, and those reasons produce exactly the overlap that makes the question unanswerable with 74 data points.
The sell-the-news rule does not survive six thresholds across 74 conferences
There is another thing we wanted to test. Some say that conferences mark local tops. The pre-event run-up brings in retail, the speakers take the stage, and then the price quietly bleeds back down over the following month. Sell the news.
We ran it on the same 74 conferences. For each event, we measured BTC’s return in the 30 days before and the 30 days after, grouped the events by how hot the pre-run was, and compared the post-event averages between hot and cool groups.
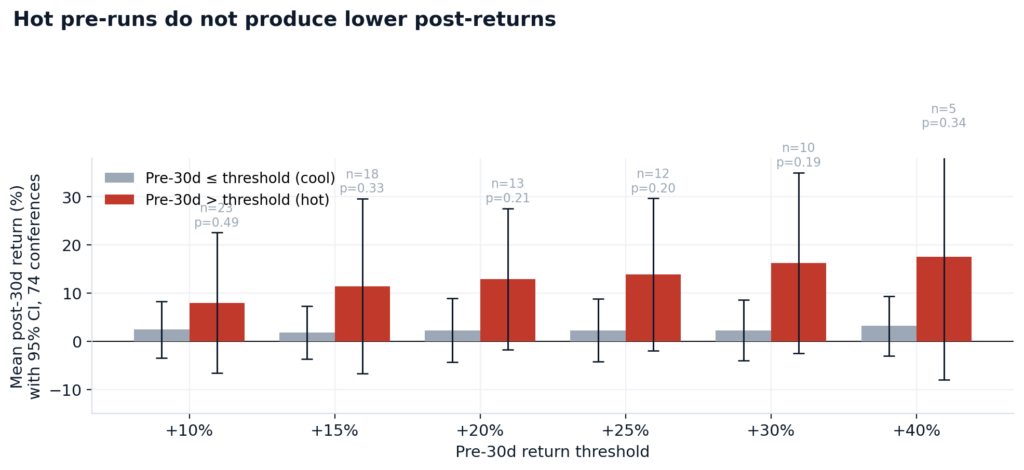
- The hot group, where Bitcoin had already rallied +20% or more before the conference, contained 13 events, and on average, they returned +13% in the month after the event.
- The other 61 events, the cool group, returned +2.3% in the same window.
We tried the same split at six different thresholds, from 10% up to 40%, and at every single one, hot pre-runs were followed by stronger post-returns. That is the opposite of what sell-the-news predicts.
The gap, though, is too noisy to call rock-solid. The hot group is small at every threshold, and the swings inside it are wide enough that a few events going the other way would change the average. At no cut-off does the data lean toward “hot conferences fade harder afterward.” Every cut-off leans the other way.
We also lined up all 74 events by the size of their pre-run and then by the size of their post-return, and asked whether bigger pre-runs systematically lead to bigger or smaller post-returns, and the answer came back as no relationship at all.
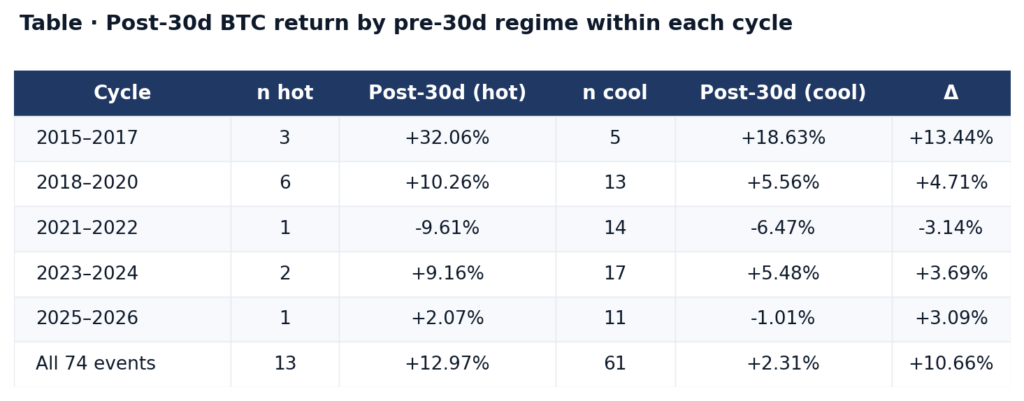
Only one cell in the table above, the 2021–2022 hot bucket, shows a negative average, and it rests on a single observation. One event cannot carry a finding. The pooled gap of +10.66% sits in the wrong direction for a sell-the-news rule, and across four of the five cycles in the table, the hot group’s average post-return is positive.
Which brings us back to where we started.
Practical conclusions
Conference timing does not predict a Bitcoin reversal in this dataset, and conference months do not reliably bring extra readers to US crypto outlets. Asian outlets pick up a single-digit percentage bump that looks real in the aggregate test but dissolves once you look at where that bump actually lives, which is one cluster of 27 outlets in one month that happened to coincide with a cycle top and the largest liquidation event in crypto history.
None of that makes conferences worthless. A booth at TOKEN2049 still puts a founder in front of investors who flew in for that exact week. A speaker slot still earns the kind of stage that takes years to build any other way. The hallway conversations still close partnerships that no amount of cold outreach replicates.
Those are real outputs, and nothing in this data touches them. What the data does touch is the traffic and press lift, and on that front, the case mostly evaporates once you control what Bitcoin is doing.
So, if your goal is to generate broad retail awareness or drive a surge of media traffic, your marketing budget is better spent elsewhere, or at least timed to market momentum rather than an event calendar. Ultimately, sponsorship buyers must separate the physical value of the room from the digital noise surrounding it.
Pay for the stage time, the booth, and the handshakes. Just do not pay a premium for a Bitcoin price pump you would have gotten for free.
Maximize your Cointribune experience with our "Read to Earn" program! For every article you read, earn points and access exclusive rewards. Sign up now and start earning benefits.

The Cointribune editorial team unites its voices to address topics related to cryptocurrencies, investment, the metaverse, and NFTs, while striving to answer your questions as best as possible.
The views, thoughts, and opinions expressed in this article belong solely to the author, and should not be taken as investment advice. Do your own research before taking any investment decisions.