Bitcoin: An inevitable decline towards $35,000!
Just like previous cycles, the price of Bitcoin experienced a correction matching the Fibonacci ratio of 0.618, around $48,000. Nothing new at this stage. Traders must now focus on the Bollinger Bands to determine the next move.
The Fibonacci retracement signals a return of Bitcoin to $35,000
The middle of the current Bitcoin peak is right in the usual range of a mid-cycle, between the green year and blue year on the chart, which correspond to the peaks of the two previous Halving cycles.
Some are betting on the bullish impact of the recent Bitcoin spot ETFs to change the game this time. Yet, the market is once again following the classical pattern of the previous cycles to the letter.
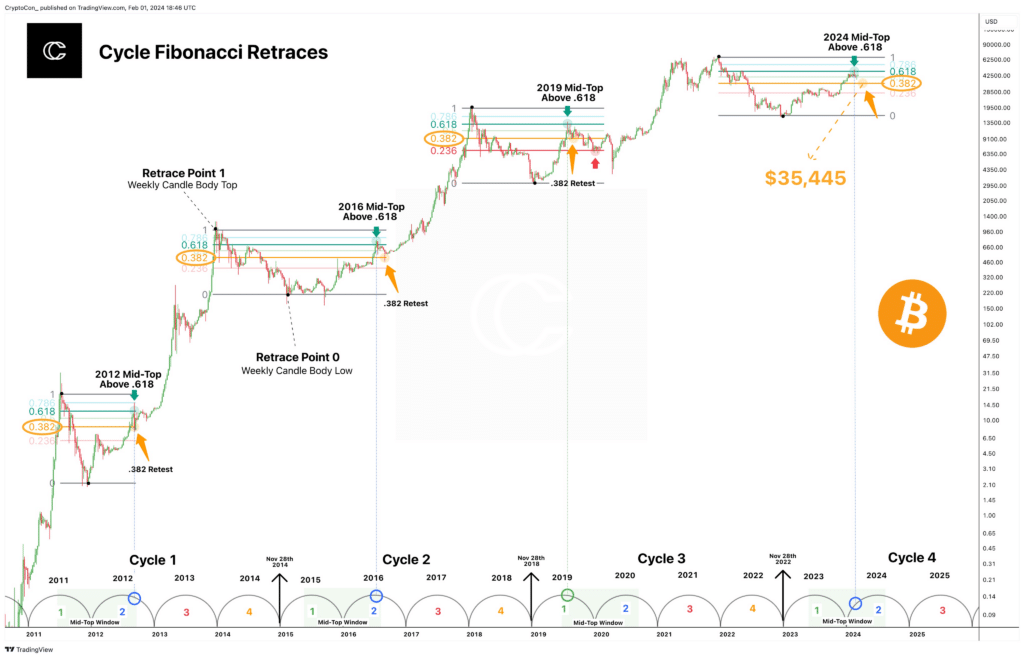
Indeed, historically, according to a analysis recently published by the specialized site CryptoCon, the price of Bitcoin tends to be slightly below the 0.382 threshold after its median peak, during the Fibonacci retracement.
In concrete terms, after reaching $48,000, that is to say the Fibonacci retracement of 0.618, Bitcoin should fall back to the level of $35,445, corresponding to the retracement of 0.382. In previous cycles, the trough after the middle of the peak was consistently below this famous threshold.
The $30,000 support level, which has been tested several times in recent months, is therefore very likely to be revisited by March before the price starts to rise again. It will probably be necessary to wait for this floor level to be reached before seeing Bitcoin rebound.
A market in tune with the previous cycles
While some traders are on the lookout for the next Fibonacci supports, others are beginning to focus on an additional indicator: the Bollinger Bands.
This tool analyses the volatility of the price by measuring the gap between three bands: the central band corresponds to the simple moving average of the price, while the upper and lower bands are located at two standard deviations from this average. When these bands tighten and the width between them reaches extremely low levels, it indicates that a major directional movement is preparing.
However, according to an analysis by Coindesk, on the monthly chart of BTC, the width between these Bollinger Bands has just reached historic lows observed during the previous two cycles, before the powerful rallies of late 2020 and 2016.
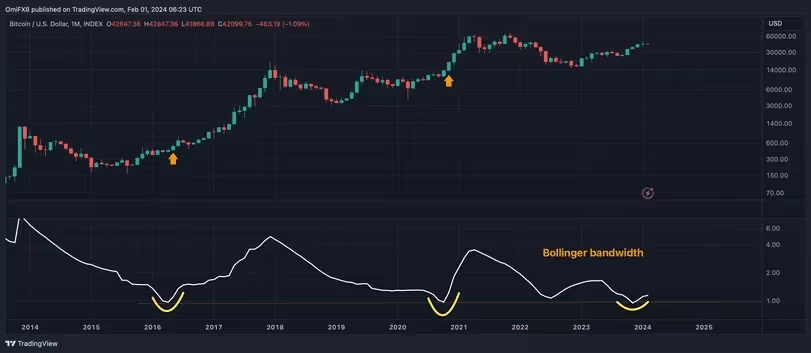
Without guaranteeing the direction of the future trend, this configuration is statistically indicative of an upcoming explosion in volatility and potentially the price of Bitcoin. Given the bullish context fueled by the resounding success of the first spot ETFs, a majority of analysts bet on new all-time highs beyond $69,000 by 2023.
One thing seems certain: the most patient Bitcoin holders should be rewarded after this long phase of consolidation. The queen of cryptos is presumably about to initiate an extreme directional movement soon.
Maximize your Cointribune experience with our "Read to Earn" program! For every article you read, earn points and access exclusive rewards. Sign up now and start earning benefits.

Passionné par le Bitcoin, j'aime explorer les méandres de la blockchain et des cryptos et je partage mes découvertes avec la communauté. Mon rêve est de vivre dans un monde où la vie privée et la liberté financière sont garanties pour tous, et je crois fermement que Bitcoin est l'outil qui peut rendre cela possible.
The views, thoughts, and opinions expressed in this article belong solely to the author, and should not be taken as investment advice. Do your own research before taking any investment decisions.