Bitcoin has dropped back below $70,000: Crypto Analysis of March 19, 2024
After reaching a new ATH, Bitcoin closes the week once again below $69,000. Let’s analyze the future prospects for BTC price together.

Bitcoin (BTC) Situation
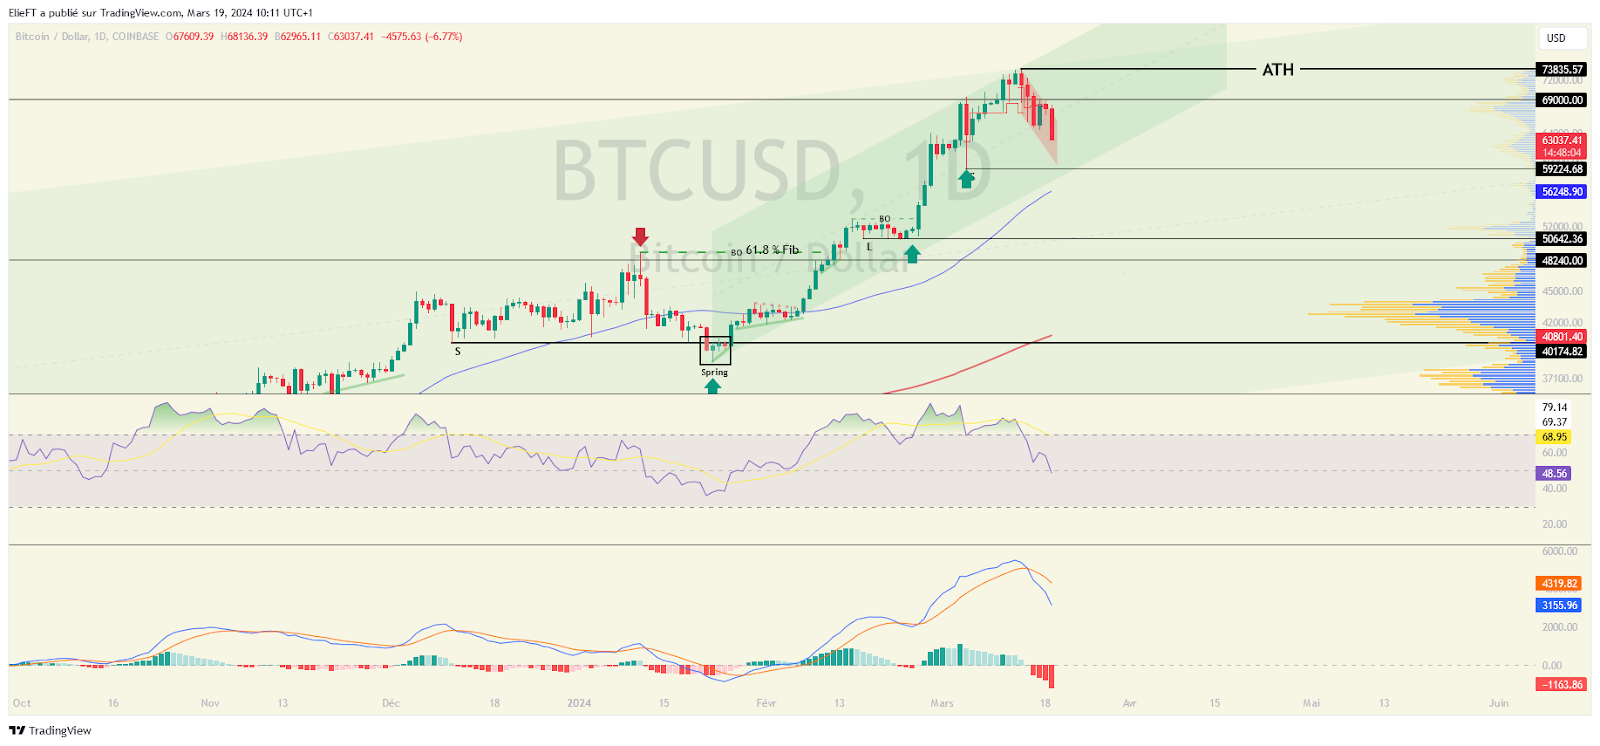
After achieving a historically high level at $73,800, Bitcoin experienced a decrease counteracting the recently established buying strength. Indeed, this drop has formed a bearish structure, pulling BTC’s price back to approximately $63,500. This represents roughly a 14% decrease from its all-time high (ATH). At the time of writing this article, the Bitcoin price is trading around $63,500. It is therefore below the main value zone, which is around $67,000. The value zone below that price is around $63,000 – $62,000. Below that, we can highlight the support zone around $60,000.
Naturally, the gap with the 50-day moving average seems to be rebalancing, as well as the oscillators, indicating a readjusted market dynamic.
The current technical analysis was conducted in collaboration with Elie FT, an investor and trader of passion in the cryptocurrency market. Today a trainer at Family Trading, a community of thousands of proprietary traders active since 2017. It offers Lives, educational content, and mutual assistance regarding financial markets in a professional and warm atmosphere.
Focus on Derivatives (BTCUSDT)
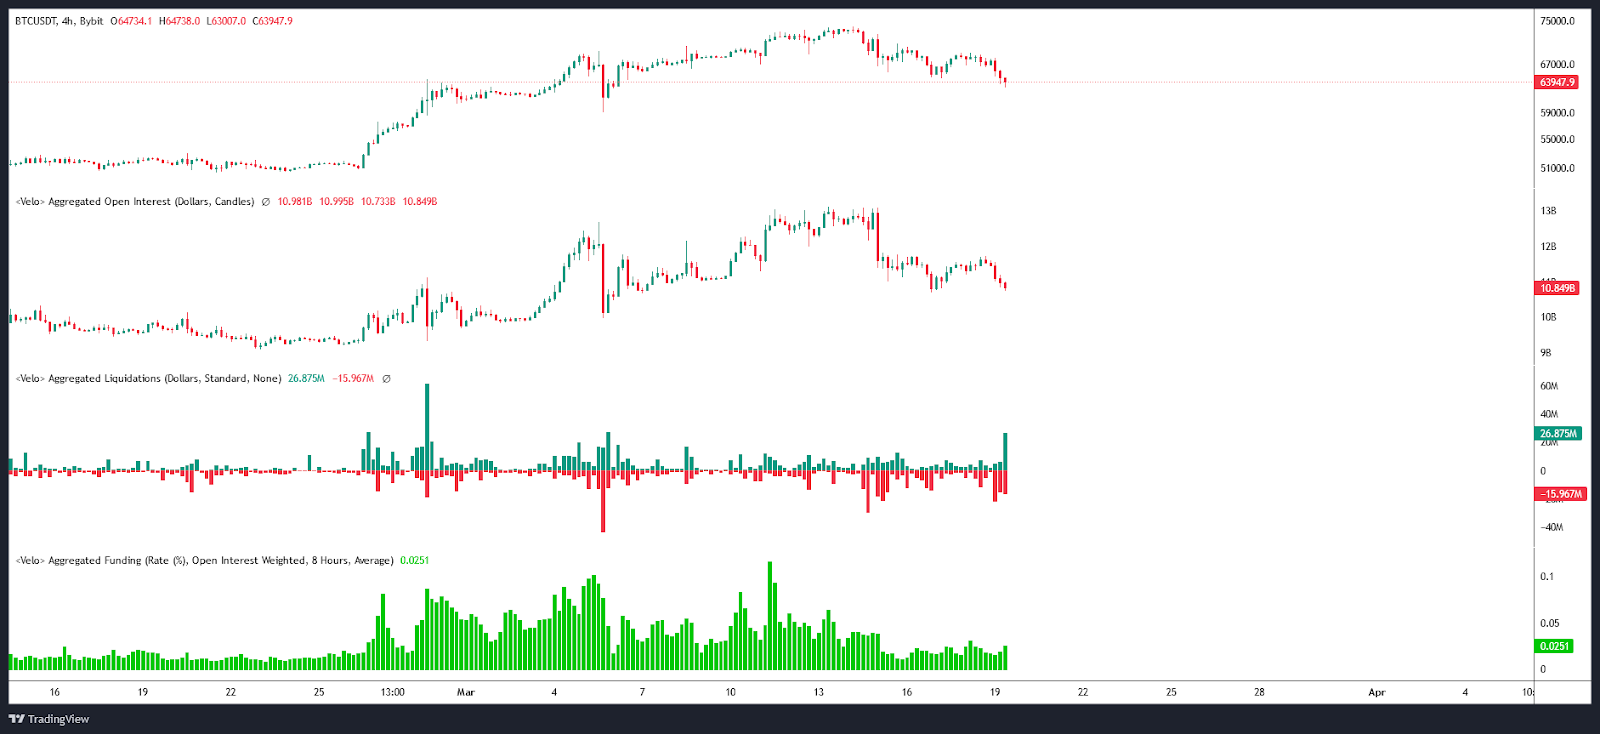
Not surprisingly, open interest in BTC/USDT contracts has been revised downwards. We can see that this decline was coupled with predominantly buyer liquidations and a decrease in the funding rate, suggesting a semblance of buyer capitulation. It is important to note that a decrease in the funding rate can be viewed positively once it is considered excessively high. Indeed, it may indicate a return to equilibrium between the market and its underlying asset, thus helping to decrease the sell pressure that could be applied to these contracts.
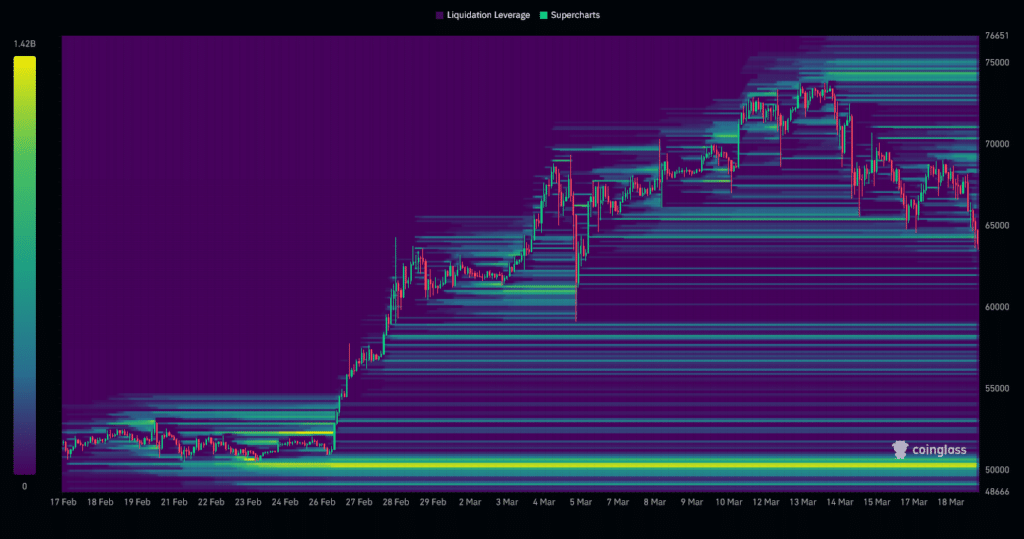
The liquidation heatmap for BTC/USD shows that recently its price crossed a significant liquidation zone around $70,500. The fact that the Bitcoin price remains above this level is evidence of persistent buying interest. Currently, the most marked liquidation zones are on either side of the current price: above, the $74,000 zone stands out, and below, the $50,000 zone where a concentration of orders is located. However, a more subtle liquidation zone can be noted in the price range around $58,000 to $56,000, and above the current price, between $71,000 and $69,000. As the market approaches these levels, we could witness a massive trigger of orders, which could potentially increase the cryptocurrency’s volatility. These zones thus represent major points of interest for investors.
Scenarios for the Bitcoin (BTC) Price
- If Bitcoin’s price manages to hold above $62,000, we could consider a new increase up to $69,000. The next resistance could be $70,000 or possibly $71,000. Beyond that, the next resistance could be above the ATH, which is above $74,000. Reaching this last level would mark an increase of approximately +16%.
- If Bitcoin’s price does not manage to hold above $62,000, we could consider support from buyer interest in the $60,000 zone. The next level to consider if the downward movement continues would be around $58,000 or possibly $56,000. At this stage, it would represent a drop close to -11%.
Conclusion
Bitcoin has recently undergone a significant correction of 14% from its all-time high, now trading around $63,500, below the key value zones, while showing signs of market stabilization according to technical indicators. However, it will be crucial to closely observe the price reaction to different key levels to confirm or refute the current assumptions. It is also important to remain vigilant against potential “fake outs” and market “squeezes” in each scenario. Lastly, let us remember that these analyses are based solely on technical criteria, and the price of cryptocurrencies can otherwise move rapidly based on more fundamental factors.
Maximize your Cointribune experience with our "Read to Earn" program! For every article you read, earn points and access exclusive rewards. Sign up now and start earning benefits.

Family Trading est une Communauté de traders a compte propre active depuis 2017 offrant Lives, contenus éducatifs et entraides autour des marchés financiers dont celui des cryptomonnaies avec à ses côtés Elie FT, investisseur et trader de passion sur le marché crypto.
The contents and products mentioned on this page are in no way approved by Cointribune and should not be interpreted as falling under its responsibility.
Cointribune strives to communicate all useful information to readers, but cannot guarantee its accuracy and completeness. We invite readers to do their research before taking any action related to the company and to take full responsibility for their decisions. This article should not be considered as investment advice, an offer, or an invitation to purchase any products or services.
Investment in digital financial assets carries risks.
Read more