Bitcoin: The Market Consolidates After the Rise
The cryptocurrency market enters a phase where every level counts. On Saturday, September 26, 2026, bitcoin trades below its all-time high after a pullback from 87,374 dollars. The rise since mid-September remains visible despite less sustained activity. The hourly, four-hour, and daily charts show consolidation around 84,000 dollars. From then on, supports near 83,000 dollars and resistances from 85,500 to 86,000 dollars focus traders’ attention.

In Brief
- The price trades around 84,162 dollars after its rejection at 87,374 dollars.
- The market consolidates between 83,000 and 85,000 dollars with declining volumes.
- Supports from 83,000 to 83,500 dollars remain decisive for the trend.
- Moving averages show a majority of positive signals on the daily chart.
- A break from 85,500 to 86,000 dollars could restart the rise toward 87,374 dollars.
Bitcoin Slows Down After Its September Rebound
At 8:30 a.m. Eastern Time, the bitcoin price reaches 84,162 dollars, a 0.51% decrease over 24 hours. Trades remain contained within a range between 83,230 and 84,662 dollars. This evolution comes after the rejection at 87,374 dollars, reached after a strong rise since mid-September. Over seven days, the increase still totals 3.64%, while it is 8.85% over two weeks.
The cryptocurrency market capitalization reaches around 1.69 trillion dollars, with a daily average volume of 27.86 billion. Meanwhile, sellers seek to prevent a sustainable return to resistance levels.
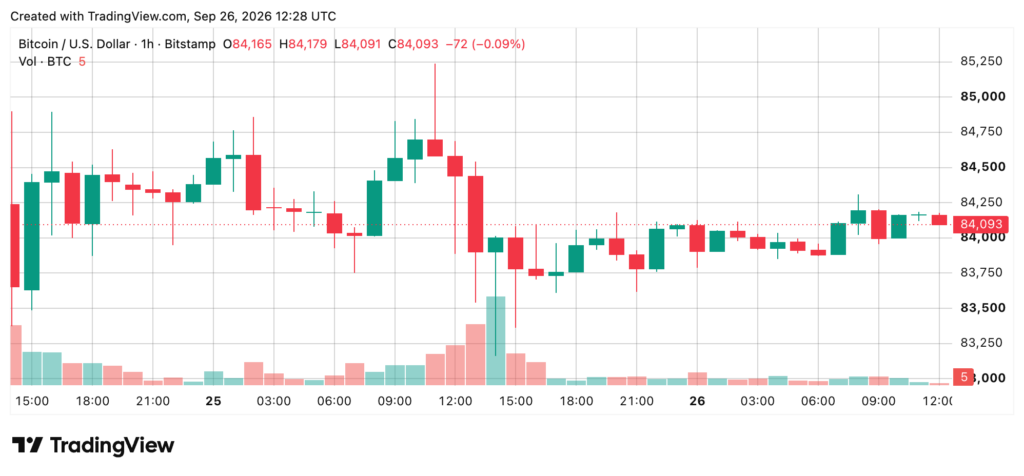
On the BTC/USD 1-hour chart via Bitstamp, the rise observed since September 19 now appears slower. The price was then near 77,353 dollars before reaching 87,374 dollars on September 22. Since this peak, candles have narrowed, and volumes have also decreased. This setup mainly reflects a waiting phase between the two camps, without a new established directional move.
Supports Near 83,000 Dollars Remain Monitored
On the hourly chart, bitcoin’s price moves within a narrower zone, approximately between 83,500 and 85,000 dollars. Maintaining above this zone, accompanied by increased volumes, could support a new attempt to rise. Conversely, an hourly close below 83,000 dollars would signal a possible continuation of the correction that began after 87,374 dollars.
The four-hour chart presents a similar situation, with consolidation after breaking through an old zone between 75,000 and 83,000 dollars. Since then, prices have returned to a tighter zone, while candle bodies have become smaller. Volume has also contracted after its peak recorded during September’s rise.
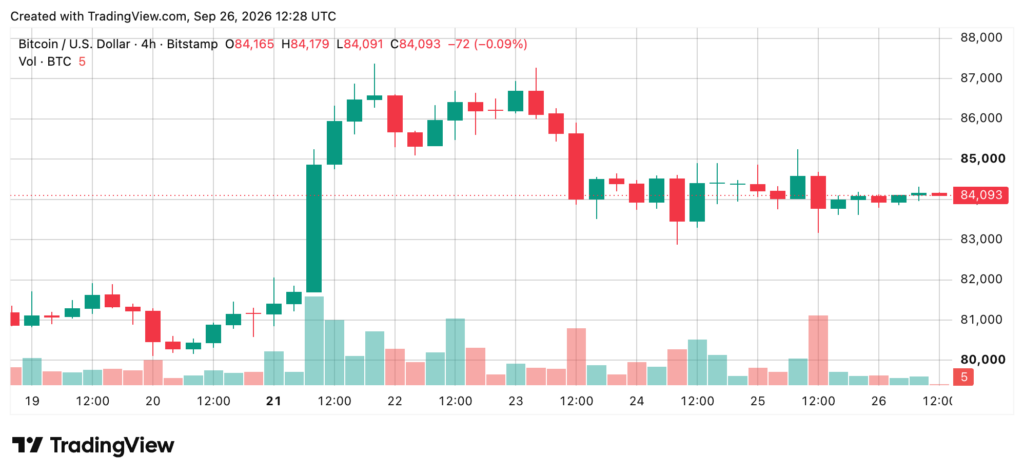
The zone between 83,000 and 83,500 dollars thus constitutes a major support. If this zone breaks down sustainably, levels between 80,000 and 81,000 dollars could become important again. Conversely, a confirmed break of 85,500 to 86,000 dollars, with increased trades, would put 87,374 dollars back at the center of attention. The market is thus once again positioned between an identified support zone and resistance.
The Daily Chart Retains a Recovery Structure
On the daily timeframe, bitcoin retains a recovery structure after its rebound from 57,735 dollars in June. The rise then led the price to 87,374 dollars in September, before the current pullback. Despite this correction, the price remains well above several important moving averages.
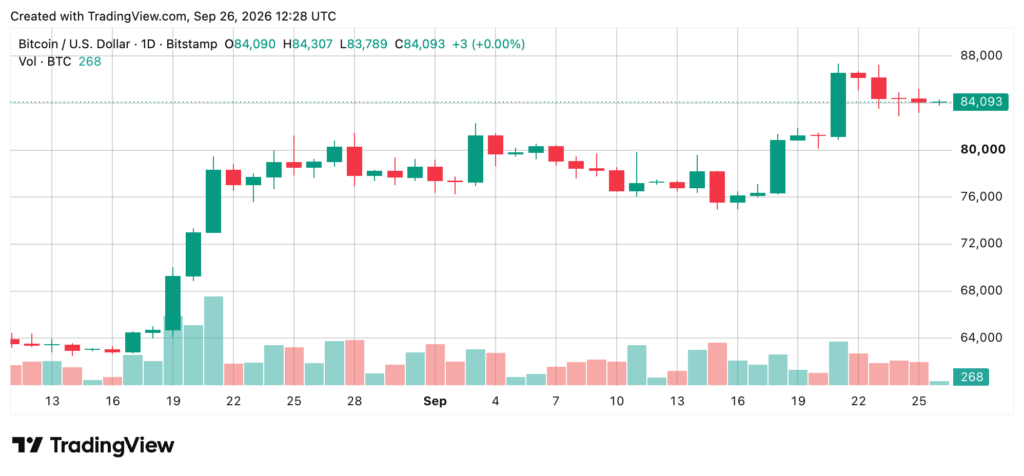
The zone between 80,000 and 81,000 dollars is a set of supports that traders are following. Several technical indicators reinforce this zone, while 85,945 dollars appears as a first important resistance pivot. Below, a sustained loss of the support could change the current reading of the daily chart.
The daily volume of bitcoin also provides an important element in this analysis. It has moderated compared to movements observed during June sales and the September rally. This phase accompanies more of a consolidation period, during which buyers and sellers await a clearer signal. This reading aligns with the consolidation visible on hourly and daily charts.
Oscillators Give Still Mixed Signals
Daily oscillators show a mostly neutral reading, with nine neutral values, one positive, and one negative. According to data relayed by Bitcoin News, the RSI reaches 64, while the stochastic stands at 75 and the CCI at 89. These three indicators remain classified as neutral according to the provided data. The ADX reaches 44, and the Awesome Oscillator shows 5,114, also in a neutral reading.
Momentum reaches 8,026, but its signal remains negative. Conversely, the MACD stands at 2,452 and is the only positive value among the presented oscillators. The Bull Bear Power reaches 3,475 and the Ultimate Oscillator stands at 62.
These data mostly show a still-mixed bitcoin dynamic after September’s rise. No group of indicators currently provides a uniform signal to characterize a new acceleration. Thus, oscillators remain to be considered alongside price levels and observed volumes. This reading aligns with the consolidation visible on hourly and daily charts.
Moving Averages Remain Generally Oriented Towards Bitcoin’s Rise
Still using data from Bitcoin News, bitcoin moving averages over 24 hours show a clearly more favorable reading, with 13 positive values, one neutral, and one negative. The price is above the EMA and SMA at 10 periods, both at $82,943. It also stays above the EMA at 20 periods at 81,049 dollars and the SMA at 20 periods at 80,148 dollars. These levels provide several reference points below the current price.
Moving averages at 30 periods are at 79,429 dollars for EMA and 79,704 dollars for SMA. At 50 periods, the EMA reaches 76,729 dollars and the SMA reaches 75,708 dollars. The EMA at 200 periods reaches 74,031 dollars, while the SMA at 200 periods is at 71,002 dollars.
The Ichimoku baseline remains neutral at 81,144 dollars, while the VWMA at 20 periods shows a positive signal at 80,170 dollars. The only mentioned exception concerns the HMA at 9 periods, at 84,784 dollars, which displays a negative signal. The whole thus retains a generally positive orientation, but this reading does not eliminate more cautious oscillator signals. The next evolution will mainly depend on the price reaction around identified supports and resistances.
In the short term, the market remains divided between a still visible recovery and a narrowed consolidation. Staying above 83,000 dollars would preserve the support zone, while a drop below this threshold would expose levels from 80,000 to 81,000 dollars. Conversely, a rise above 85,500 to 86,000 dollars, accompanied by higher volumes, would place 87,374 dollars back among the levels to watch. The BTC thus maintains a recovery structure, but upcoming moves will need to confirm this trend.
Maximize your Cointribune experience with our "Read to Earn" program! For every article you read, earn points and access exclusive rewards. Sign up now and start earning benefits.

Journaliste et rédacteur web passionné par l’univers des cryptomonnaies et des technologies Web3. J’y traite les dernières tendances et actualités afin de proposer un contenu de haute qualité à un large public du secteur.
The views, thoughts, and opinions expressed in this article belong solely to the author, and should not be taken as investment advice. Do your own research before taking any investment decisions.