Bitcoin Back Above $64,000 Despite Geopolitical Tensions
The bitcoin market regains some momentum as tensions between Washington and Tehran dominate trading. BTC/USD surpassed 64,000 dollars, with a daily gain of more than 2%. Meanwhile, US stocks fell and gold accelerated, strengthening the divergence between major markets. This development comes as investors also watch derivatives, where funding rates signal a forceful long positioning in the markets.
In brief
- Bitcoin returns above 64,000 dollars after a daily rise of more than 2%.
- Tensions between the United States and Iran weigh on US stocks.
- Gold rises by more than 1% and reaches a daily high of 4,427 dollars.
- Derivatives funding rates reach their highest level in 20 months.
- Liquidations remain moderate, with 180 million dollars over 24 hours.
Bitcoin benefits from a rebound above 64,000 dollars
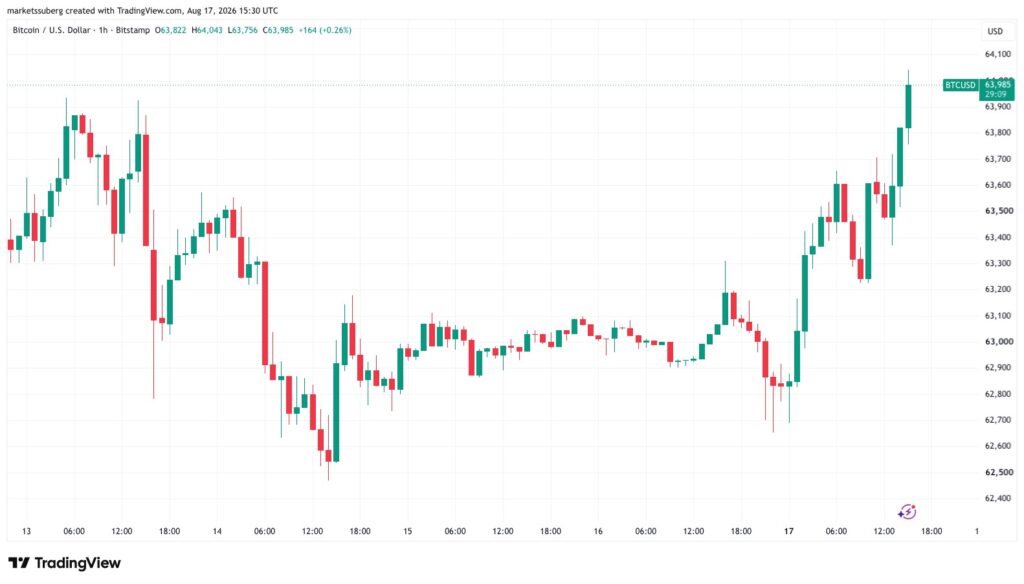
According to TradingView data, BTC/USD gained more than 2% during the day. The movement comes after Sunday’s weekly close and brings the bitcoin price above 64,000 dollars, as shown by the chart below. This gain remains within a recent range. The market is therefore looking for more signals before seeing a lasting breakout.
Meanwhile, US stocks moved in the red. The S&P 500 lost 0.5% from its historic record on Thursday. This decline comes ahead of the expiration of the 60-day ceasefire agreement between the United States and Iran. Statements regarding Oman added further tension to the macroeconomic context.
On Fox News, Donald Trump threatened Oman with military action over the dispute about reopening the oil route in the Strait of Hormuz. Despite this context, oil did not react strongly. WTI remained stable at 82.35 dollars per barrel. Markets therefore showed different reactions to the tensions.
Gold accelerates as markets remain tense
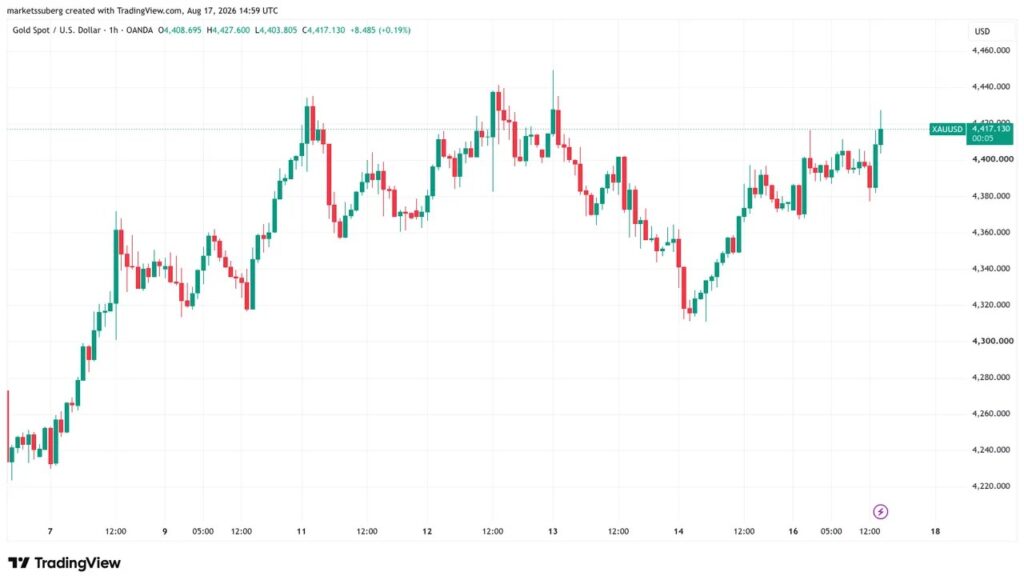
Gold saw a more marked move early in the week. The precious metal rose more than 1% to reach 4,427 dollars an ounce. This rise comes as interest from individuals and governments supports the market’s high levels. Flows into exchange-traded products confirm this dynamic.
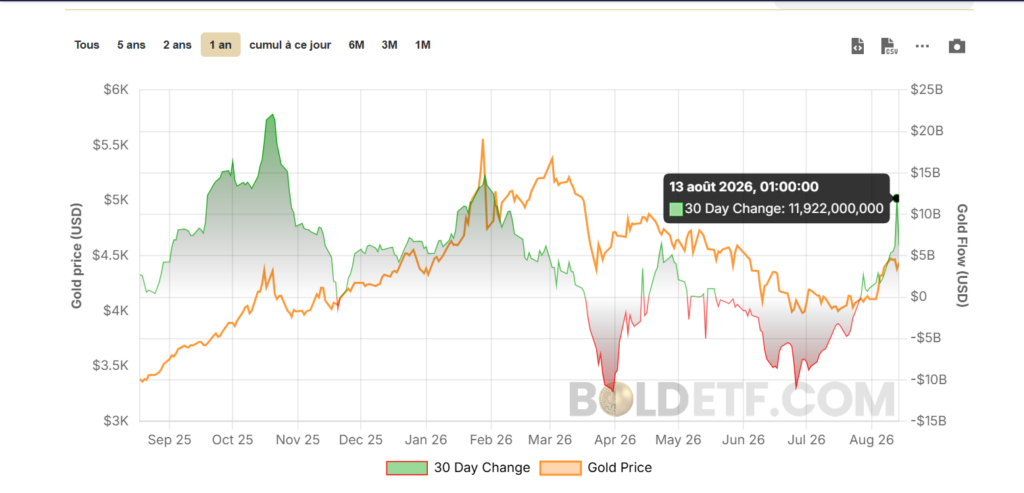
Bytetree data shows that 30-day inflows into gold-backed ETFs reached nearly 12 billion dollars as of August 13. These figures illustrate capital directed to this type of product. Gold thus maintains an important place among tracked assets. Its rise contrasts with the decline in some US stocks.
In a note cited by Investing.com, Michael Hartnett, a strategist at Bank of America, considered gold as the best option. He presented it as a hedge against dollar depreciation, bond collapse, and asset inflation. This interpretation comes as political tensions influence markets. The contrast with bitcoin remains visible.
Bitcoin derivatives show more crowded positioning
QCP Capital points out that bitcoin resists macroeconomic factors without clearly moving out of its recent range. In its Market Color bulletin published Monday, the firm believes isolated price levels provide little directional information. It favors observing a sustained move outside this zone. Such a development would allow deeper understanding of market positioning.
Moreover, CoinGlass data shows liquidations remain moderate as BTC/USD approaches 64,000 dollars. Cross-crypto liquidations over 24 hours reached 180 million dollars. The market had previously anticipated that a return to 61,000 dollars could trigger the unwinding of long positions. This scenario would have increased downward pressure.
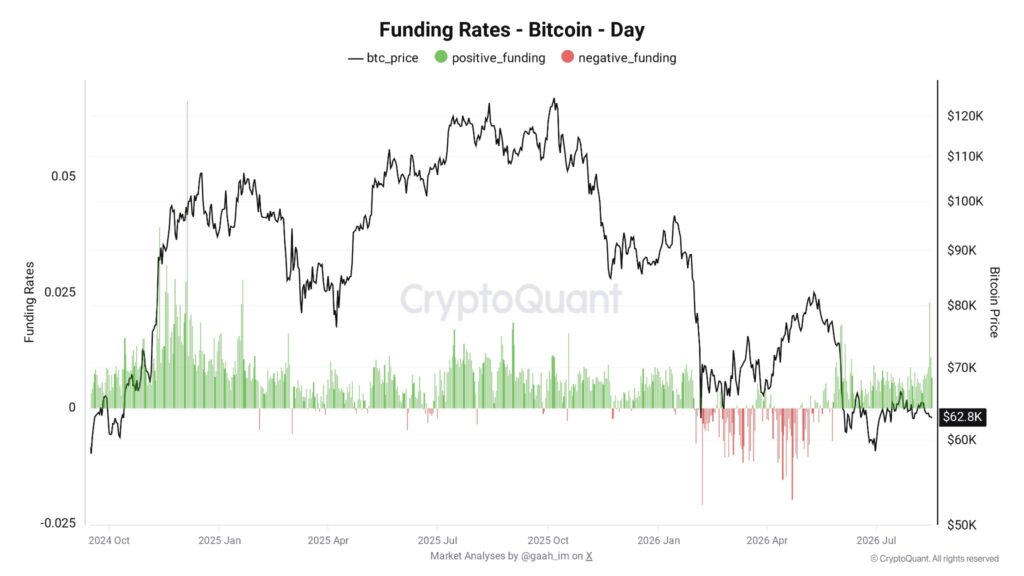
CryptoQuant provides another element with derivatives funding rates. These reached 0.022 on August 14, their highest level in 20 months. According to the platform, this level reflects positive sentiment and a strong presence of long positions. The derivatives market thus appears more crowded despite contained liquidations.
Futures volumes increase market vigilance
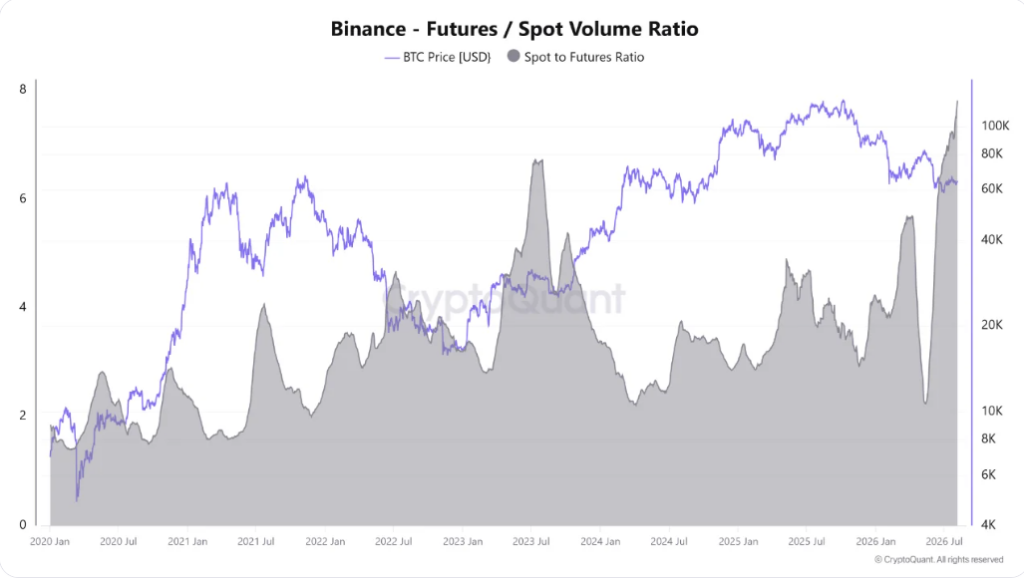
CryptoQuant had also noted a significant gap between futures and spot markets on Binance. Futures contract volume exceeded nearly eight times that of the spot market. This difference highlights the weight of derivatives in observed activity. It also explains the importance of funding rates in market monitoring.
For QCP Capital, bitcoin’s resilience to macroeconomic tensions remains notable. However, the firm stresses the importance of a sustained breakout from the recent range. Limited moves within this zone provide fewer clues about the market’s future direction. This approach aligns with data showing a price near the bottom of its range.
In the short term, investors have several indicators to watch. BTC/USD trades above 64,000 dollars, while gold rises and US stocks fall. Meanwhile, high funding rates signal a market more oriented toward long positions. Bitcoin’s next move could depend on its ability to sustainably break out of its current range.
Maximize your Cointribune experience with our "Read to Earn" program! For every article you read, earn points and access exclusive rewards. Sign up now and start earning benefits.

Journaliste et rédacteur web passionné par l’univers des cryptomonnaies et des technologies Web3. J’y traite les dernières tendances et actualités afin de proposer un contenu de haute qualité à un large public du secteur.
The views, thoughts, and opinions expressed in this article belong solely to the author, and should not be taken as investment advice. Do your own research before taking any investment decisions.