Bitcoin, S&P 500… Are Markets Too Overvalued?
In the last quarter of 2023, the S&P 500 advanced by nearly 12%. The price of bitcoin (BTC) has also climbed by more than 60% over the same period. Thus, this classic “year-end rally” is added to the perspective of US elections and monetary policy, generally a very positive signal on the markets. While breezes of europhoria are being felt, some analysts are questioning potential excesses in financial markets. Decryption of the bullish potential.
Bitcoin (BTC) Takes Off Faster Than Indices
The correlation of the price of bitcoin (BTC) with stock market indices is a major indicator. Indeed, a durable bull market on bitcoin begins with a strong correlation to stock market indices. This correlation dwindles to negative or none when bitcoin (BTC) marks a peak.
Thus, the correlation between bitcoin and the indices is generally minimal, or even negative, in the presence of major bitcoin peaks.
Bitcoin remains correlated with indices
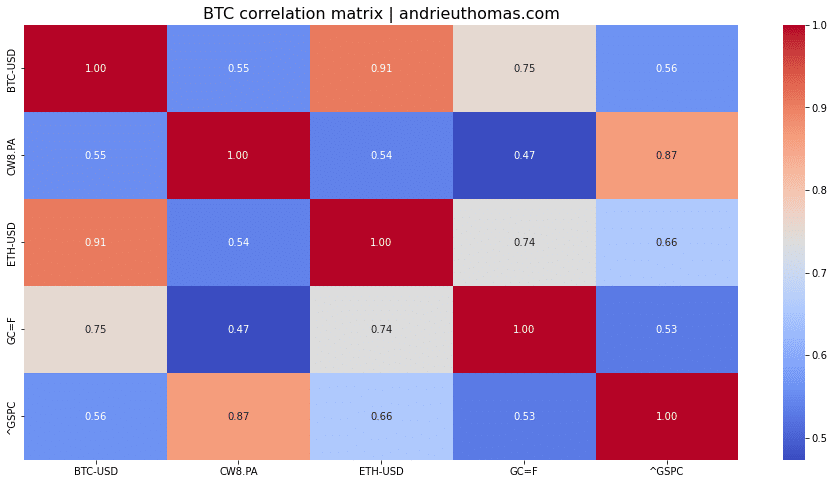
At the end of December 2023, the correlation between bitcoin (BTC) and the S&P 500 over the last 6 months is close to +56%. Furthermore, this correlation is weaker than that observed in June 2023 (+70%). This observation implies two important conclusions:
- On one hand, this indicates that the rise of bitcoin is somewhat more “disconnected” from other markets.
- On the other hand, such a level of correlation (50%) has generally accompanied, or preceded just a bit, a bullish frenzy. However, if bitcoin were to rise in a way uncorrelated with the markets, this could constitute a bearish signal.
An “excessive” rise in the markets?
The biggest mistake a cautious investor can make is to expose themselves to the markets irrationally. In other words, the risk is buying too expensively with an open door to significant losses. At the end of 2023, the essential valuation ratios of the S&P 500 show several interesting elements:
- The P/E ratio of the S&P 500 (price / earnings) is 26, 10 points more than the historical average. While this level is somewhat “elevated” and invites caution, it is not abnormal in the context of the previous decade. Similarly, the CAC 40’s P/E ratio is 24.5, which is historically (very) high.
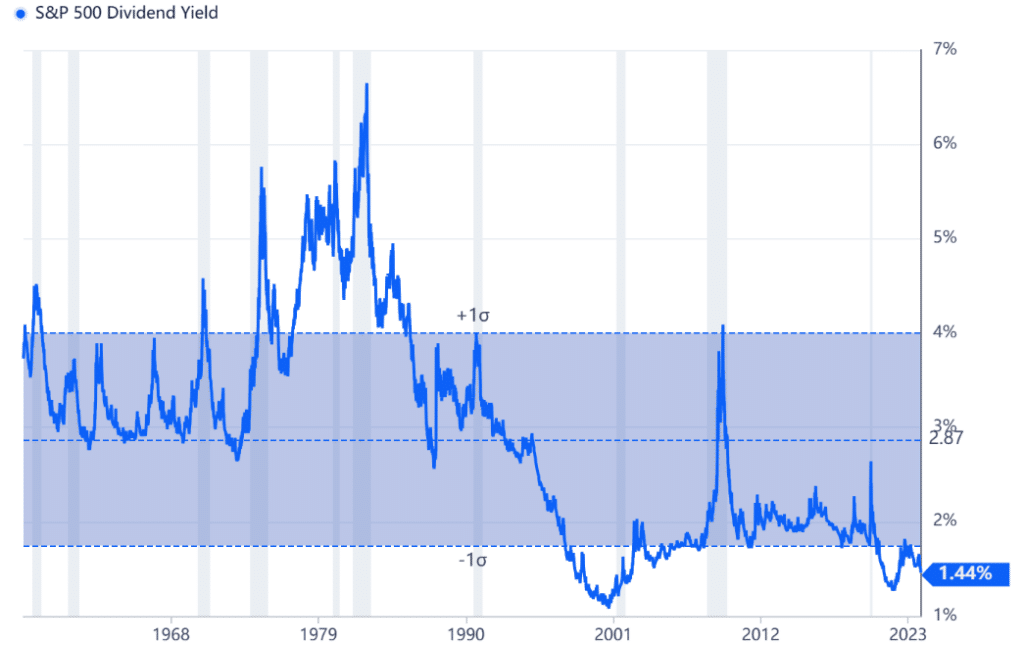
- The earnings yield of the S&P 500 is close to 3.8%. This corresponds to the 10-year rate of the US government. An increase in the S&P 500 is conceivable only with a decrease in rates. However, the S&P 500’s dividend is less than 1.5%, which is historically very low.
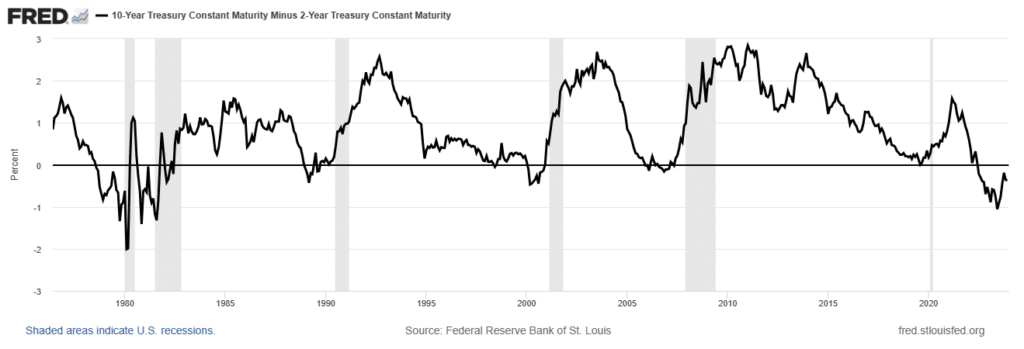
This significant revaluation of assets at the end of 2023 is also explained by unmanifested risks. In 2022, Bloomberg predicted a recession would occur in 2023. But this did not happen… The economy remained robust, and the markets seem to have corrected a persistent worry about rates (a recession would have limited the rise in rates). Nevertheless, the gap between long and short-term rates indicates that investors still perceive more short-term risk. The probability of a recession is not negligible, but it may occur in 2025 (or 2026), or later.
The Central Banks Will Have the Last Word
We have seen that the valuation ratios of stock indices are high. However, the stock indices are based on the assumption that rates will reduce in the long term. Thus, the money supply could resume its growth pace. The graph below clearly illustrates this assumption. In January 2022, financial markets reacted in anticipation to the interest rate hike, leading to a significant fall in the S&P 500. In this framework, the rebound observed at the end of 2023 on the S&P 500 thus erased a (too) significant correction.
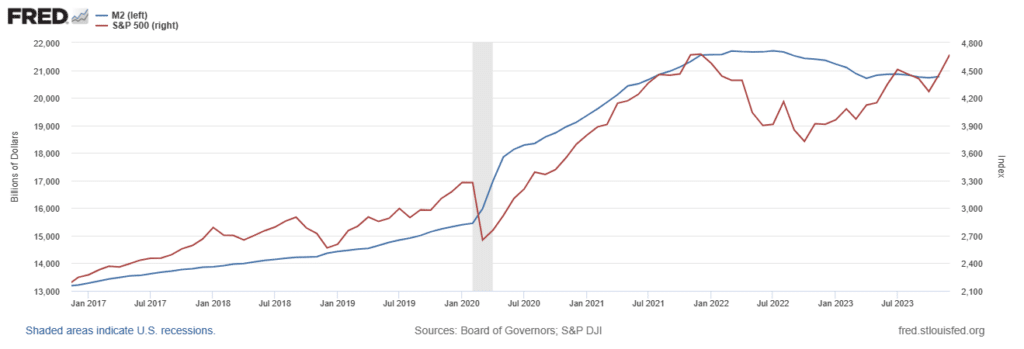
The end of 2023 seems to indicate that the S&P 500 is evaluated slightly above its monetary trajectory. Hence, the financial markets bet on a stabilization or reduction of rates from 2024 onwards (increase in the demand for credit). Confirmation of this trend will take place during the year 2024. But it is also clear, from this chart, that the potential for increase seems more limited than in 2021. This observation could also be applied to the price of bitcoin (BTC).
The criteria monitored by the FED will be the level of inflation and the unemployment rate. The unemployment rate has remained below 1.8% since March 2022. An unemployment rate rising beyond 2% would announce a good probability of witnessing an economic slowdown, or even a recession. Meanwhile, the inflation rate (year-on-year) has been stagnant between +3% and +3.7% since June 2023. A maintenance of inflation at this level would lead to a stagnation followed by a slight decrease in rates. Otherwise, a further reduction in inflation would lead to very positive prospects for all markets.
Potential Targets?
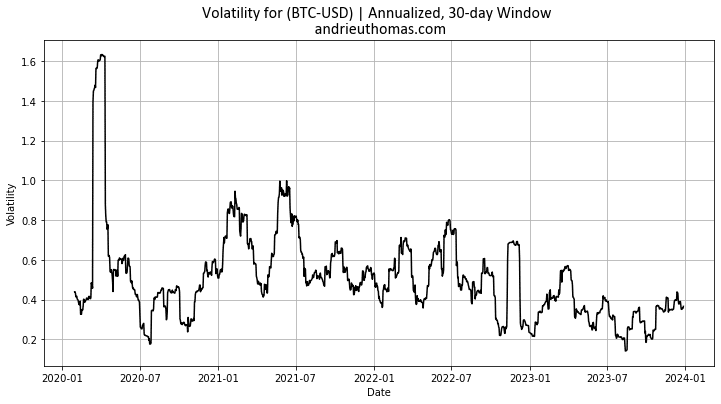
As an unchanging rule, the volatility of bitcoin diminishes over the long term. That is to say, the amplitude of bitcoin’s variations is less. Nevertheless, it is remarkable that most bull markets are accompanied by an increase in volatility. At the end of 2023, the volatility of bitcoin is close to 36%, against an average of 50% since 2020. Moreover, it is significant that extreme upward variations (with a theoretical probability of 1% of occurring) manifested in October 2023. Indeed, we observed a daily variation of over 12%, which is generally a positive signal (which had not occurred since the end of 2022).
Taking into account both the instability of the price of bitcoin (BTC) and the difference in price from the historical norm, we can sketch a potential upside. Indeed, it is quite striking to see that the average of the variations observed on bitcoin since 2020 would allow, in the most favorable scenario, to multiply the price of bitcoin at the end of 2023 by 2.6 (43,000$ x 2.6). This is close to the Fibonacci extensions in technical analysis (2.618). An increase in the price of bitcoin beyond this threshold would have a probability of less than 5% of occurring.
Key levels
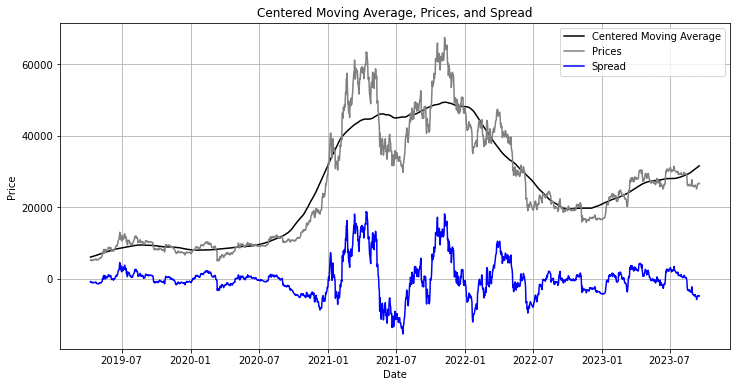
However, the use of normal statistics on bitcoin requires great caution, as the divergence with reality is often substantial. The proposed approach allows us to visualize statistically conceivable levels. Moreover, the price of bitcoin remains close to its long-term moving average over 200 periods. As a result, this means a bullish move would have enough room to flourish, up to $20,000 above this average.
This approach allows us to affirm, in the case of a favorable scenario, that the first target would be close to $50,000 (then the last historical peak by extension). Then, if a particularly intense bullish trend manifests over a year, there are some chances (albeit small from the standpoint of normal statistics) of reaching the zone of $100,000 // $110,000. Conversely, as a major support, we will retain the last lows ($16,000 // $20,000).
Finally, an approach through Fibonacci retracement of the entire 2022 bearish movement allows us to conclude the importance (downwards) of the following thresholds: $27,000, $32,000, $41,500, $48,000.
Conclusion
To conclude, we have shown that the price of bitcoin (BTC) has a more independent trajectory. Indeed, the correlation of bitcoin with the S&P 500 is decreasing. This is an essential characteristic of bullish markets on bitcoin. This rise in bitcoin may then appear more difficult to understand in a particularly bullish end-of-year environment.
Stock indices in general show already high valuation ratios. Financial markets are based on the assumption (already built into prices) that the money supply should gradually resume its growth pace. Without this, bearish pressures could emerge in early 2024. Liquidity is an essential issue for all markets, particularly cryptocurrencies. This favorable scenario will only be validated if unemployment does not fall back and if inflation remains stable or decreases.
In the case of bitcoin, the volatility of prices has decreased in recent months. This phenomenon is entirely in line with the dynamic of the bullish recovery. A statistical approach helps us to better understand the potential developments of the bitcoin price. In particular, Fibonacci extensions seem relevant to monitor.
Maximize your Cointribune experience with our "Read to Earn" program! For every article you read, earn points and access exclusive rewards. Sign up now and start earning benefits.

Author of various books, financial and economics editor for many websites, I have been forming a true passion for the analysis and study of markets and the economy.
The views, thoughts, and opinions expressed in this article belong solely to the author, and should not be taken as investment advice. Do your own research before taking any investment decisions.