Celestia (TIA) breaks the ceiling: Analysis of February 01, 2024
Celestia exceeds expectations since its listing. Let’s look at the upcoming prospects for the price of TIA.

Celestia’s Situation (TIA)
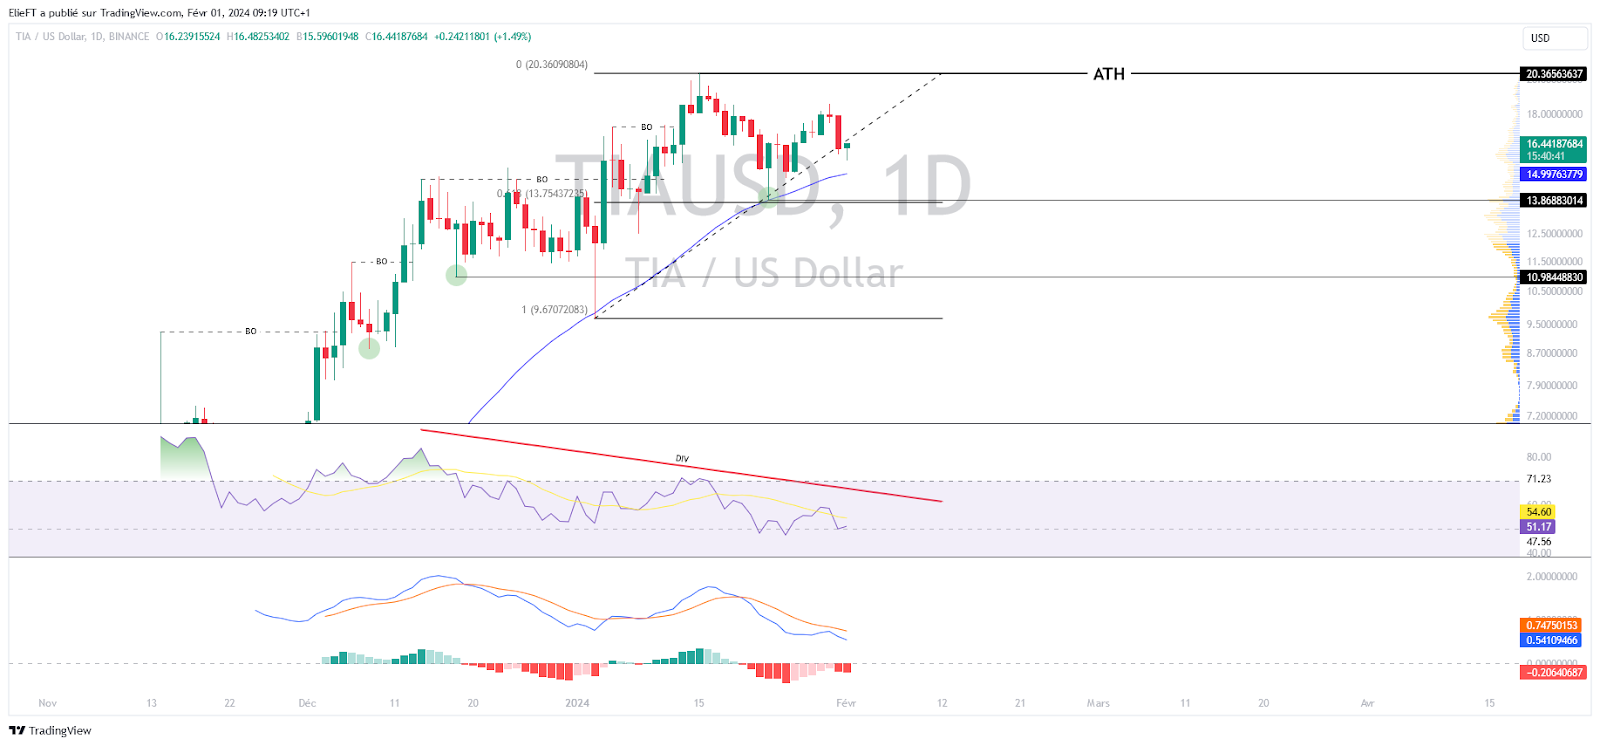
Since its introduction on Binance at the end of October 2023, the cryptocurrency TIA has recorded an impressive increase of over 830%. Its price went from around $2.5 to a historical high (ATH) of $20.36, all in less than three months. Thus, TIA has successfully surpassed several peaks. Today, the Celestia price is trading around $16.3. Consequently, Celestia has undergone a correction phase that allowed it to reach a low point of $13.9. Since this price level, it seems that interest in the cryptocurrency has picked up significantly again. It is important to note that this rebound occurred at the Fibonacci retracement level of 61.8%, calculated from the rise of $9.7 to its historical peak (ATH).
Given the newness of the cryptocurrency, it is not yet possible to visualize its 200-day moving average. However, we observe that Celestia is above its 50-day moving average, suggesting that the cryptocurrency is currently in an upward trend. That being said, it is clear that TIA shows an increasingly weak buying dynamics. This observation can be confirmed by the oscillators that, currently, diverge from its price. From an optimistic point of view, this could suggest that the cryptocurrency is currently undervalued. However, from a more pessimistic angle, this could also be interpreted as a sign that Celestia’s momentum is heading towards a bearish trend.
The current technical analysis was performed in collaboration with Elie FT, an investor and enthusiast trader in the cryptocurrency market. Now a trainer at Family Trading, a community of thousands of proprietary traders active since 2017. There you’ll find Live sessions, educational content, and support around financial markets in a professional and friendly atmosphere.
Focus on Derivatives (TIAUSDT)
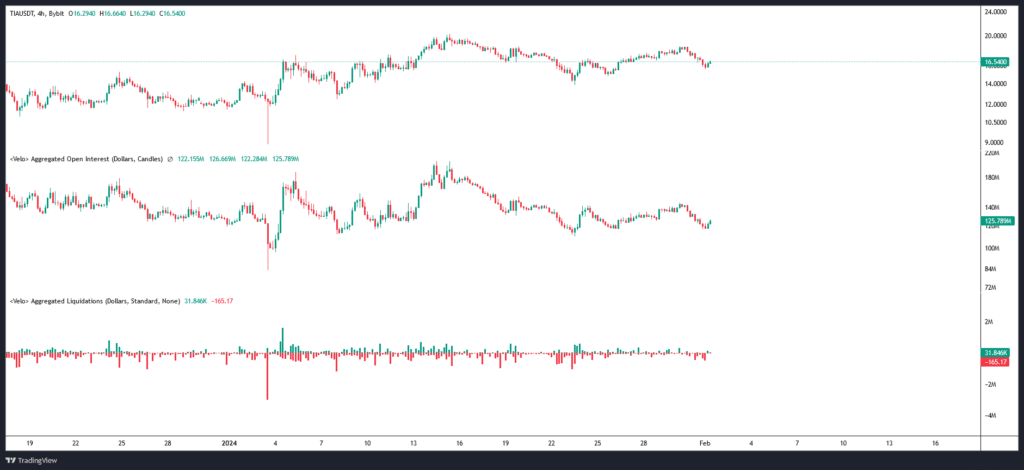
The open interest in Celestia seems to evolve in parallel with the movements of its price, increasing when the price goes up and decreasing when it dips. This indicates participation mainly oriented towards buying on the part of traders. As for liquidations, their negligible significance indirectly suggests a general confidence of investors in the current trend.
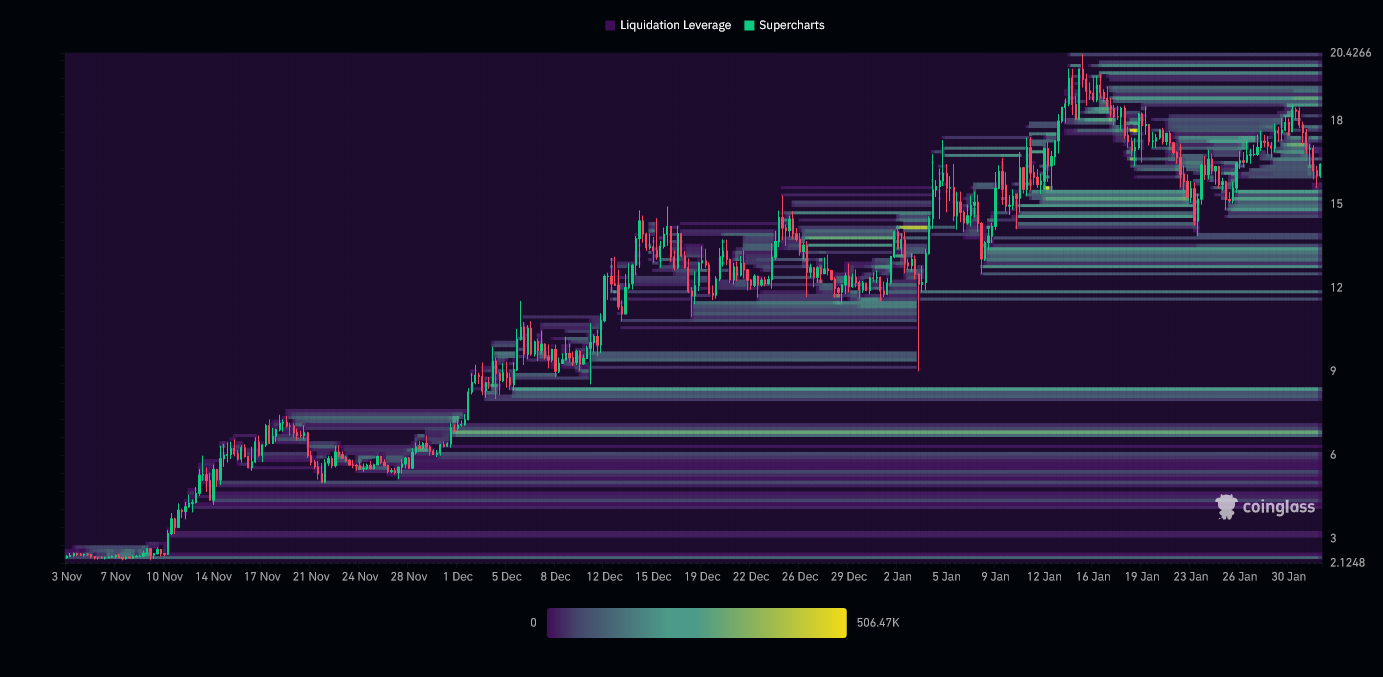
The liquidation heat map for Celestia reveals several important areas to consider. Below the current price, the $15 zone is notable, followed by the $12 to $13 zone. Above the current price, the areas of $18 to $19 and, even higher, the $20 zone deserve attention. The approach of the price towards these levels could trigger a massive number of orders, thus increasing the possibility of a period of heightened volatility in Celestia. These zones, therefore, represent crucial points of interest for investors.
Hypotheses for the Celestia price (TIA)
- If Celestia’s price holds above $13, we could anticipate a continuation of the upward trend up to $18.5, or even up to its ATH. If the latter is breached, the next bullish target could be $24, a level determined by Fibonacci extensions. At this stage, it would represent an increase of over 45%.
- If Celestia’s price fails to hold above $13, we could envision a retreat towards the $12 to $11 range. In case of continuation of the bearish movement, the next level of support to consider would be around $8. At this level, the decline would represent approximately -50%.
Conclusion
Celestia continues to hit historical records. It appears that its bullish momentum is starting to wane. Although it is too early to question TIA’s bullish trend, it is important to remember the following saying: “Trees don’t grow to the sky”. It serves as a reminder that, despite impressive and continuous growth, no market can climb indefinitely. Thus, it will be crucial to closely observe the price’s reaction to different key levels to confirm or refute the current assumptions. It is also important to remain vigilant for potential “fake outs” and market “squeezes” in each scenario. Lastly, let’s remember that these analyses are based solely on technical criteria and that the price of cryptocurrencies can also move rapidly due to more fundamental factors.
Maximize your Cointribune experience with our "Read to Earn" program! For every article you read, earn points and access exclusive rewards. Sign up now and start earning benefits.

Family Trading est une Communauté de traders a compte propre active depuis 2017 offrant Lives, contenus éducatifs et entraides autour des marchés financiers dont celui des cryptomonnaies avec à ses côtés Elie FT, investisseur et trader de passion sur le marché crypto.
The contents and products mentioned on this page are in no way approved by Cointribune and should not be interpreted as falling under its responsibility.
Cointribune strives to communicate all useful information to readers, but cannot guarantee its accuracy and completeness. We invite readers to do their research before taking any action related to the company and to take full responsibility for their decisions. This article should not be considered as investment advice, an offer, or an invitation to purchase any products or services.
Investment in digital financial assets carries risks.
Read more