Has Bitcoin (BTC) exhausted its bullish potential?
The bull market of 2024 is already well underway, as many indicators show a sharp weakening of bullish strength since March 2024. It took 1 year and 4 months to reach the latest historical highs, which is roughly half of the dominant bitcoin cycle. At the same time, the halving (over-anticipated) did not move the price of bitcoin. While the trend remains bullish with a consensus target of $100,000, has bitcoin exhausted its bullish potential faster than usual?

A promising 2024 so far
In August 2023, we mentioned the high probability of a bull market. Several indicators thus showed a high probability in favor of the hypothesis of a bull market in 2024:
- On the one hand, the cyclicity of the market. Indeed, bitcoin reacts according to dominant cycles of 3.6 years. This cycle suggested that the low point of November 2022 was a major low. A bull market would then be triggered 1 to 1.5 years later.
- On the other hand, specific indicators such as fractals indicated clear bullish potential.
- Finally, the good timing of the halving also suggested a favorable psychological framework for this bull market.
| Cycle N° | Low | High | Duration low to low | Performance low to high |
| 1 | November 2011* | December 2013 | — | +968% |
| 2 | January 2015 | December 2017 | 3.1 years | +8,328% |
| 3 | December 2018 | November 2021 | 3.9 years | +1,961% |
| 4 | November 2022 | — | 3.9 years | — |
| AVERAGE | November | December | 3.6 years | +3,752% |
In all cyclical theory, bitcoin would thus be favorably exposed until early 2025 / mid-2025. Thus, since January 1, 2024, bitcoin price has risen by more than 50%. The trend therefore remains structurally bullish.
The extent of the 2024 bull market
In August 2023, we had thus judged that the bullish potential towards the previous highs was very high. Consequently, the price target of $69,000 seemed to be the first legitimate target of this bullish scenario. This target was reached and surpassed in March 2024 at nearly $74,000. The challenge now is to assess the possibility of this bull market continuing.
“Obviously, a return to the previous highs ($69,000) would be the first desirable target, followed by extensions. We know that the value of bitcoin essentially depends on the long-term use of the cryptocurrency. […] Thus, the potential for a hypothetical bull market from 2024 would depend on the ability of central banks to ease their policies, the ability of stock indices to perform sufficiently by 2025, and mechanically, the ability of the economy to remain resilient (no recession). Otherwise, it would likely delay the stated scenario. […] Therefore, it appears that the return of bullish forces could be gradual in the coming months. The current stagnation of bitcoin could be explained by a theoretical opposition between the 3.5-year trends and the 1.8-year trends.”
Cryptocurrencies: A Bull Market in 2024? – Cointribune
Is the market unusually exhausted?
To better understand the importance of timing in this 2024 bull market, we compared the different historical cycles. The current price of bitcoin since November 2022 is given by the red curve. We clearly see that the bull market observed since late 2022 fits within the historical “norm” of the dominant bitcoin cycle. Indeed, up to 2 years after the last major low point, bitcoin seems to follow a fairly reliable trajectory.
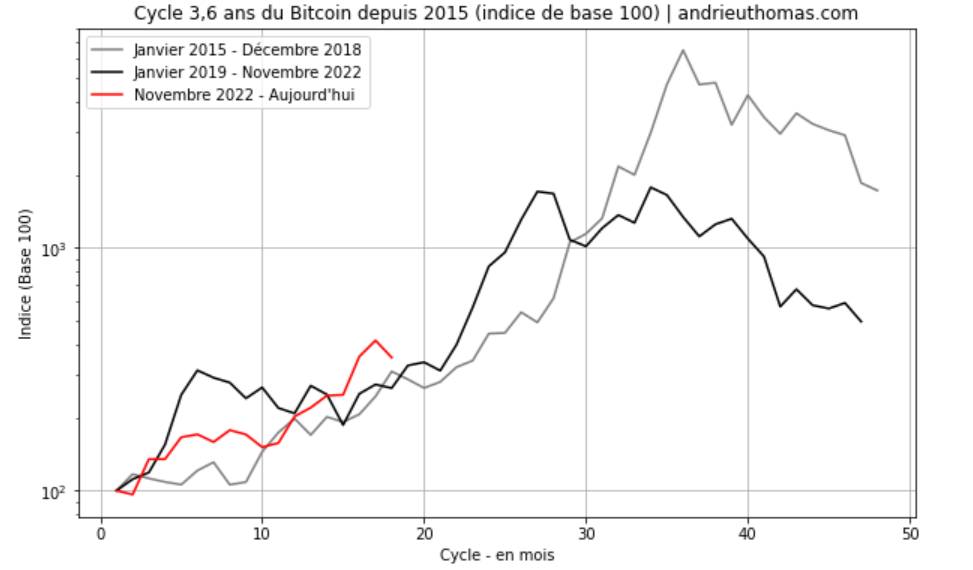
Moreover, there is a clear symmetry between historical developments and the current evolution of bitcoin price. The rise in bitcoin price since early 2024 would even tend to slightly exceed its historical norm. Consequently, the immediate conclusion would be that the consolidation movement observed since March 2024 is not abnormal, on the contrary. The corollary would even be that, with the historical scenario being respected, we could witness a second bullish phase in summer 2024.
Finally, we will note that bitcoin (BTC) price trajectory becomes less “normed” from the 25th or 30th month of the cycle. In other words, volatility increases as agents’ behavior becomes more euphoric. It will therefore be theoretically more difficult to make projections in 2025 or 2026 on bitcoin price than in 2024.
What would be the target of the historical norm?
The last two bull markets multiplied bitcoin price by between 10 and 100 times. It would therefore be legitimate for an investor to assume a bitcoin price multiplied by 10 since November 2022. This would equate to a final target close to $150,000 to $160,000, which also corresponds to the Fibonacci extension at 2.618. However, we also note that the long-term increase in bitcoin capitalization, mechanically, reduces the bullish performances from one cycle to another. This target would therefore be less founded than previous ones. Conversely, this encourages closer monitoring of bearish indicators on bitcoin in 2024 and 2025.
A glance at fractals
Fractals are quite reliable on bitcoin (BTC) price. In particular, the Hurst exponent (read more) makes it possible to measure the degree of persistence of a trend from one time scale to another. The Hurst exponent is ideally bounded between 0 and 1. In the case of bitcoin, a Hurst exponent close to 1 indicates significant bullish potential, and consequently a good symmetry with major lows. Conversely, a Hurst exponent close to 0 will indicate that the trend is anti-persistent and likely to reverse downward.
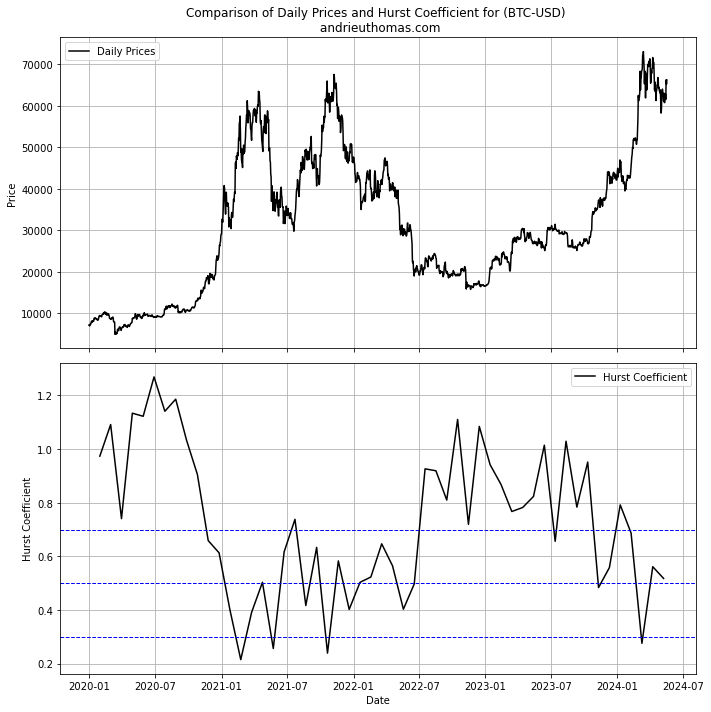
In January 2023, fractals thus showed a clear buy signal. The increase triggered in 2023 was also accompanied by strong bullish potential. However, bitcoin (BTC) price growth in 2024 was accompanied by a rapid reduction in the Hurst exponent. In March 2024, the exponent even reached the critical threshold of 0.3 (which is quite bearish…). This situation is in every way similar to that of February / March 2021. Nevertheless, the correction in March and April 2024 was accompanied by a rise in the Hurst exponent.
The bullish potential is therefore still present, but significantly weakened in light of the fractals. The market, in a way, is now at pivotal points rather than an established floor. Without a new increase in the Hurst exponent, the bullish strength of the market in 2024 could be significantly reduced.
A glance at Technical Analysis
The technical construction of the bull market on bitcoin (BTC) price is quite clear. Indeed, a major bullish trend has been forming since January 2023. This trend was perfectly structured by a flag in early 2024, whose theoretical target was close to $73,000. Now, since March 2024, we observe the formation of a wedge/flag. The extended target of this figure, now broken in mid-May 2024 by a bullish engulfing, would be almost $100,000. This also corresponds to the Fibonacci extension at 1.618. This target would be clearly confirmed by breaking $67,250 and then $73,800.
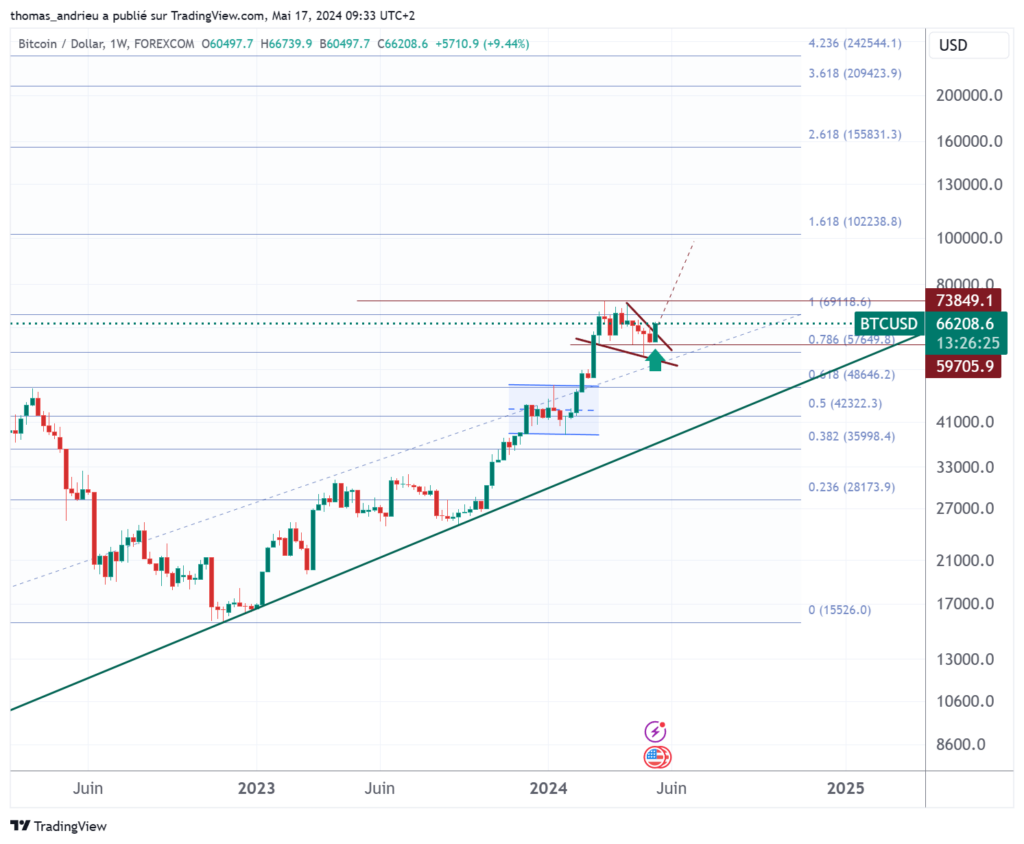
Therefore, the long-term trend remains bullish. The evolution of bitcoin (BTC) price in recent weeks shows the encouraging break of a technical consolidation figure.
In conclusion
As anticipated, the bull market on bitcoin is well advanced. The dominant bitcoin cycle still seems to act with such precision and accuracy that the timing of the market is still perfectly respected. If the long-term trend remains bullish, bitcoin’s stagnation around the previous 2021 highs encourages more caution. Let’s also note the symmetry of the current bull market with previous bull markets.
Moreover, the consolidation observed since March 2024 has confirmed a sharp weakening of the bullish strength compared to 2023. Fractals show that the bull market has significantly lost its potential during this last correction. Attention to bearish signals should ideally be strengthened. Nevertheless, it is clear that monetary and economic factors remain favorably oriented. A major and next technical target would thus be $100,000. If bitcoin behaves similarly to previous bull markets, it would not be impossible to consider $150,000, but this target would require greater bullish strength that is currently absent.
Maximize your Cointribune experience with our "Read to Earn" program! For every article you read, earn points and access exclusive rewards. Sign up now and start earning benefits.

Author of various books, financial and economics editor for many websites, I have been forming a true passion for the analysis and study of markets and the economy.
The views, thoughts, and opinions expressed in this article belong solely to the author, and should not be taken as investment advice. Do your own research before taking any investment decisions.