The seasonality of Bitcoin (BTC)
Is seasonality a myth? In this article, we will attempt to give an ideal overview of bitcoin’s comparative behavior since 2015. We’ll focus on monthly performance, effectively excluding shorter variations. The study of seasonality thus shows that October, February and July are generally the most reliable and best-performing months. Will this be the case in the coming months?

A statistical overview
A first (unadjusted) measure of seasonality consists in averaging the performance of each month of the year. This gives an average monthly performance, which may be sufficiently positive or negative to be of interest. The chart below, after processing the data, summarizes bitcoin’s average monthly performance between 2015 and 2023.
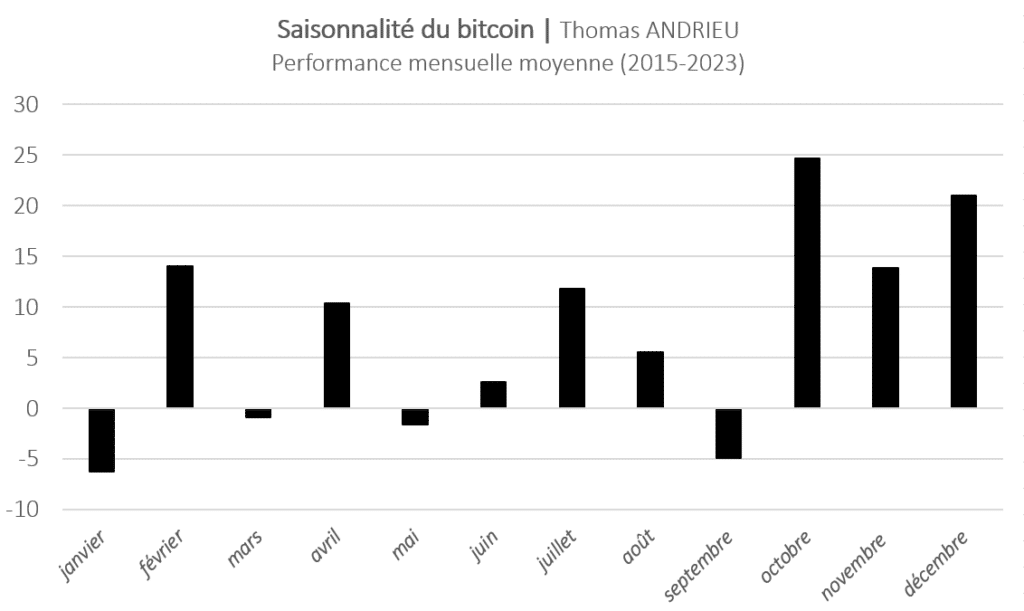
Consequently, the most bullish months are (in order) October, December, February, November, July, April, August and June. Here we find the “Christmas effect“, where the bitcoin price tends to rise at the end of the year. Conversely, the most bearish months on average are January, September, May and March. Despite this, movements seem to be most directional at the end of the year and at the early summer peak in July. The average performance of bitcoin was +24% in October and +20% in December. However, it was -6.2% in January and -4.8% in September.
What’s more, it’s clear that this average monthly performance is not necessarily representative. In fact, it is possible for the same month to record a performance of +50% and another of -10%, resulting in an average of +20%. Even so, the probability of loss in our example is 50%. We therefore favour a seasonality-adjusted bitcoin price.
Volatility-adjusted seasonality
To at least partially correct this effect of variability, we add another measure. For each month of the year, we measure the volatility of past performance. The lower the volatility, the greater the reliability of the average performance observed. In other words, we prefer a month that performs +5% but with exceptional deviations from this performance, to an asset that performs +25% on average but with past variations of -20%.
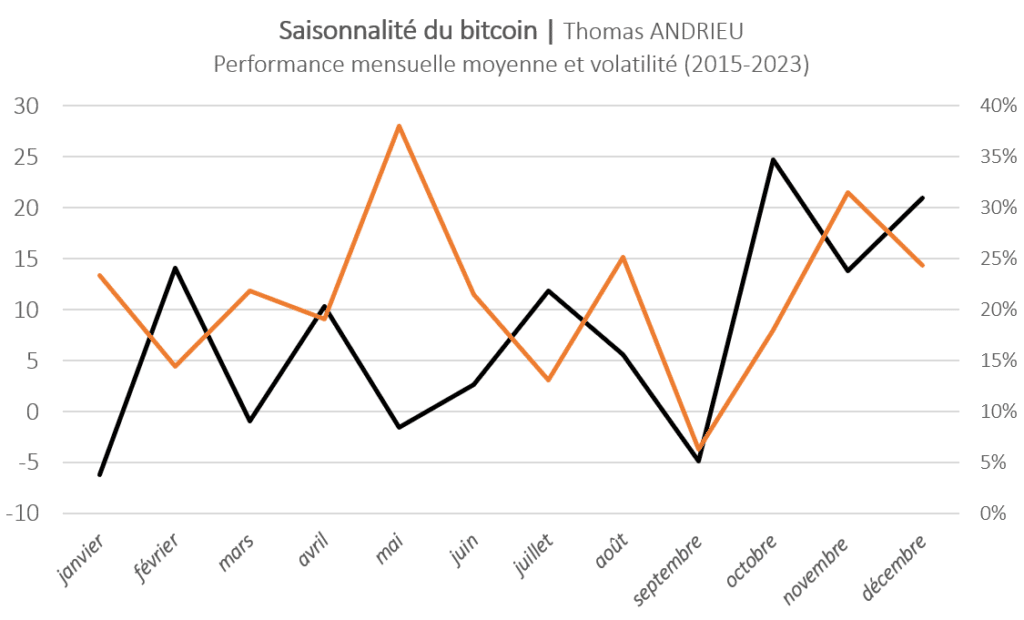
The orange curve shows the level of volatility of all variations recorded over the month in question. The black curve is consistent with the batônets presented above. The months of interest to us are therefore those with the lowest volatility and the highest average performance. In other words, these are the months with the best performance and sufficiently reliable movements. January, May, August and November don’t seem reliable enough. The volatility of these months actually exceeds 20%, even 25%.
The most reliable and best-performing months
To give a clear answer to our approach, we have represented an “index”. We divided bitcoin’s average monthly performance by its volatility. So, if bitcoin’s volatility over the month of September is very low (close to 0), then this will increase the value of the index. Consequently, the most interesting months are those with a very high index value (or very low in the negative). These are the months that best meet the reliability/performance trade-off.
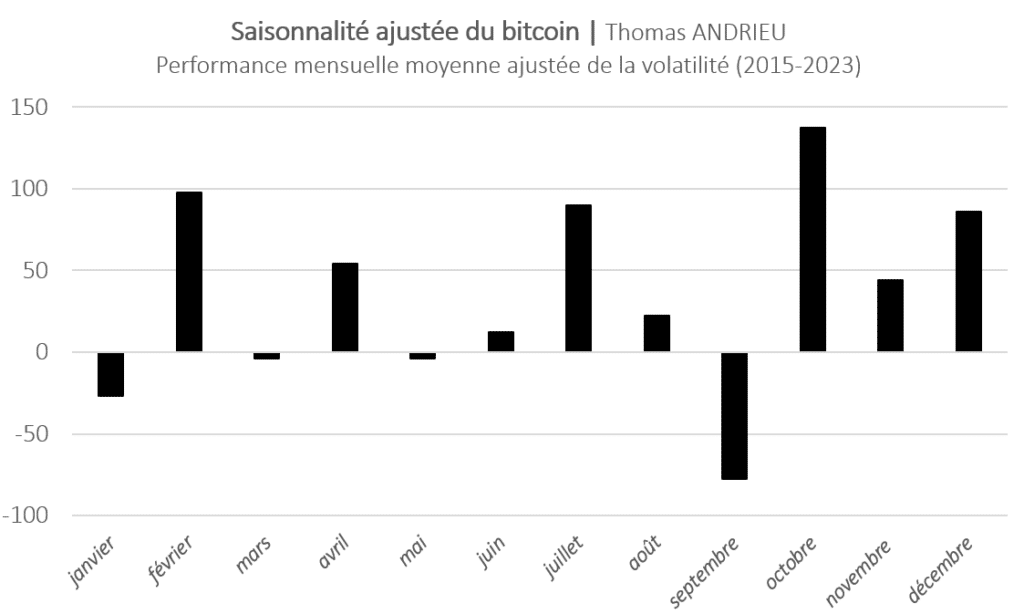
The most reliable and best-performing months are October, February, July, December and September (on the decline). Conversely, other months such as March, May, June, August, November and April don’t seem to be reliable and efficient enough. We can thus observe that, in general, antagonistic and fairly directional movements take effect in September and October. Finally, it is interesting to note that in the case of adjusted seasonality, the “Christmas effect” is less perceptible.
Scattered trends
Once we’ve described bitcoin’s seasonality, we can better represent the different years comparatively. In July of each year, we set a value index of 100. The years that ended in negative territory from July 2015 onwards were therefore 2019-2020 and 2021-2022.
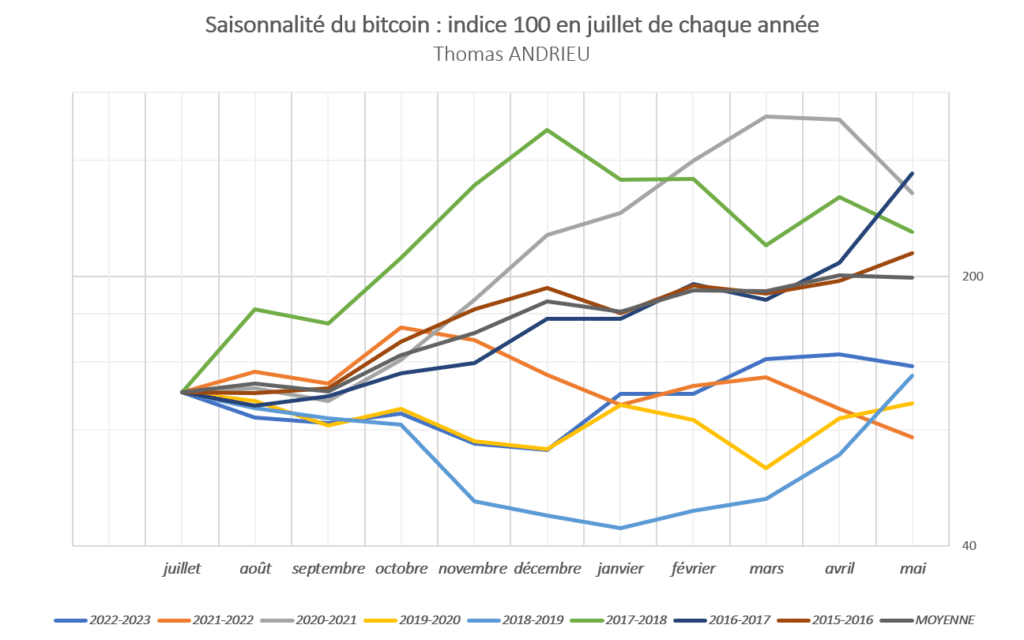
Nevertheless, bitcoin’s performance has diverged from one year to the next. The average of all these trends is shown in grey. On average, between 2015 and 2023, bitcoin tends to double between June of each year. The best year was 2016-2017, while the worst year was 2021-2022. Even so, the probability of major lows is highest in September and January.
Bitcoin’s “ideal” trajectory
It is now possible for us to observe the average of these evolutions in a graph. The average of the indices presented above is isolated in the graph below. This graph shows the “ideal” evolution of bitcoin by month of the year, based on historical prices between 2015 and 2023. We can see that the months of July, August and September are globally stagnant. This is followed by a strong uptrend from late September to December. Autumn therefore appears to be a buoyant period for bitcoin. A new phase of stagnation begins between December and January, before a rebound in the following month.
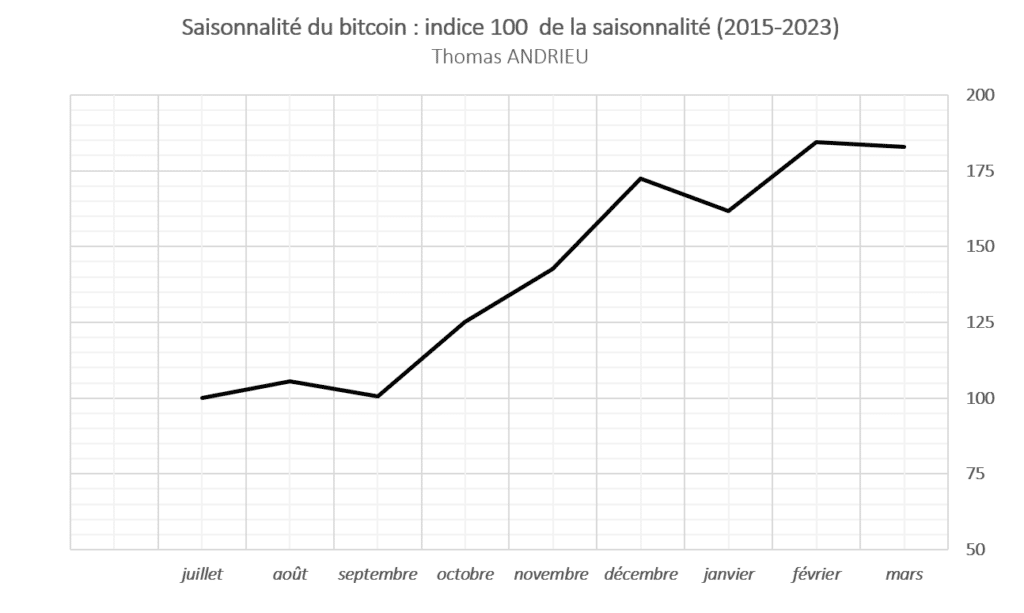
But we’ve already pointed out that not all months have the same reliability of movement. Nevertheless, this trajectory allows us to describe a typical and ideal movement for bitcoin. We can therefore highlight a temporal effect on bitcoin. 62% of the time, the bitcoin price climbs between (late) September and December. The average rise is over 70% over this period. Autumn is therefore a favorable season for bitcoin.
Months with the lowest probability of decline
As we’ve seen, seasonality is a complex issue that doesn’t stop at average performance. Another parameter to take into account is the frequency of declines over the 8 years studied. For example, if we observe 2 years with a negative January over the 8 years, then the frequency of decline is 2/8 (25%). Studying the frequency of negative months leads to the following conclusion…
The months with the lowest frequency of decline are (in order) October, February and April. These are also fairly bullish months. Conversely, September and August have a higher frequency of decline. September is therefore a fairly reliable bearish month (75% of September months are bearish), while August is disadvantaged by this observation. The other months are close to 50% bearish. October’s movement is therefore not only not very volatile, but also frequent and significant. February and April seem to stand out in this respect.
Is the bitcoin price currently consistent?
The bitcoin price rose sharply in January 2023 before stagnating in February and rebounding strongly in March. May 2023 was also rather negative. Furthermore, while October 2022 was slightly bullish, November 2022 was clearly negative. If seasonality were an intelligence in its own right, the bitcoin price could stagnate in the summer before picking up again at the end of the year. It is notable that the next halving will arrive in the spring of 2024, and that a bull run usually begins shortly before it.
Conclusion
In conclusion, the best-performing months on average for the bitcoin price are October, December, February, November and July. But that doesn’t tell us anything about the reliability of this observation (the dispersion of past performance). Seasonality-adjusted (for volatility) on the bitcoin price shows that the most profitable months are October, February, July and December, as well as September (on the downside). Even so, the small number of years studied (8) and the persistence of a gap between comparative trends mean that we need to be cautious.
Thus, we can refine our study with the frequency of declines over the months studied. In this respect, October, February and April appear to be the most reliable months, with a high frequency of increases. A major observation of our study is therefore this “autumn” effect… “62% of the time, the bitcoin price rises between (late) September and December. The average rise is over 70% over this period”.
Maximize your Cointribune experience with our "Read to Earn" program! For every article you read, earn points and access exclusive rewards. Sign up now and start earning benefits.

Author of various books, financial and economics editor for many websites, I have been forming a true passion for the analysis and study of markets and the economy.
The views, thoughts, and opinions expressed in this article belong solely to the author, and should not be taken as investment advice. Do your own research before taking any investment decisions.