Bitcoin: A September like any other?
Over the last 8 years, September has been the second-worst month in terms of bitcoin (BTC) performance. On average, bitcoin falls by 5% in September. Conversely, September is often a good opportunity. The end of the year often marks a powerful “Christmas effect”, which is usually accompanied by a rise in cryptocurrency. But if studying the past sheds light on probabilities, it’s worth looking at the indicators available on the bitcoin price.

Seasonality at work?
In a special study, bitcoin’s seasonality has been precisely demonstrated. September is, on average, the second-worst month since 2015. Indeed, August often marks a weakening of the uptrend, before September confirms a corrective movement. What’s more, this observation is fairly reliable, since 75% of September months have been bearish over the last 8 years. That’s a pretty strong statistical reliability.
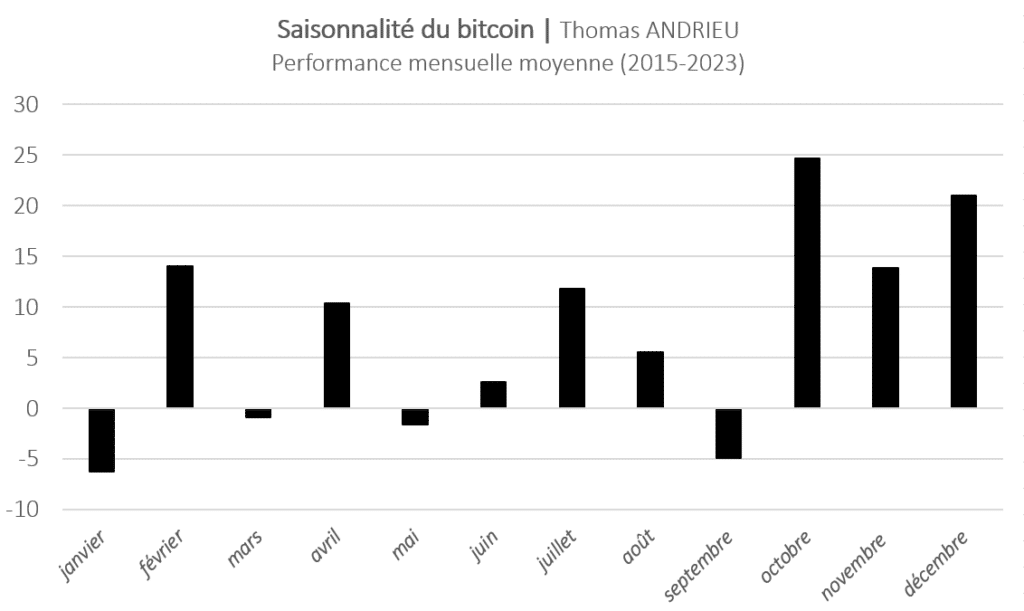
September is followed by another very reliable month on the upside, October. Indeed, bitcoin’s average performance in October is almost +25%. What’s more, October has the lowest frequency of declines of the entire year. As a result, October often appears as an adjustment to September. A rebound therefore seems to be taking shape in early autumn, but here again, this is a generalisation.
In August, the bitcoin price fell by over 11%. A significant correction, but one that is still fragilely holding on to its spring support. September opens slightly lower, but nothing is certain yet. If August was more bearish than average, we can see that September could also see a divergent trend.
September: a good time to return?
We’ve seen that year-end momentum is often favorable, but that this necessitates an often pitiful September. Against this backdrop, some would be prepared to see September as a good time to invest. But here again, confirmation of the movement on the basis of various indicators seems more reasonable.
“62% of the time, the bitcoin price climbs between (late) September and December. The average rise is over 70% over this period. We therefore have a favorable autumn seasonality for bitcoin.”
Seasonality of bitcoin (BTC) – Cointribune
“62% of the time, the bitcoin price climbs between (late) September and December. The average rise is over 70% over this period. We therefore have a favorable autumn seasonality for bitcoin.”
Seasonality of bitcoin (BTC) – Cointribune
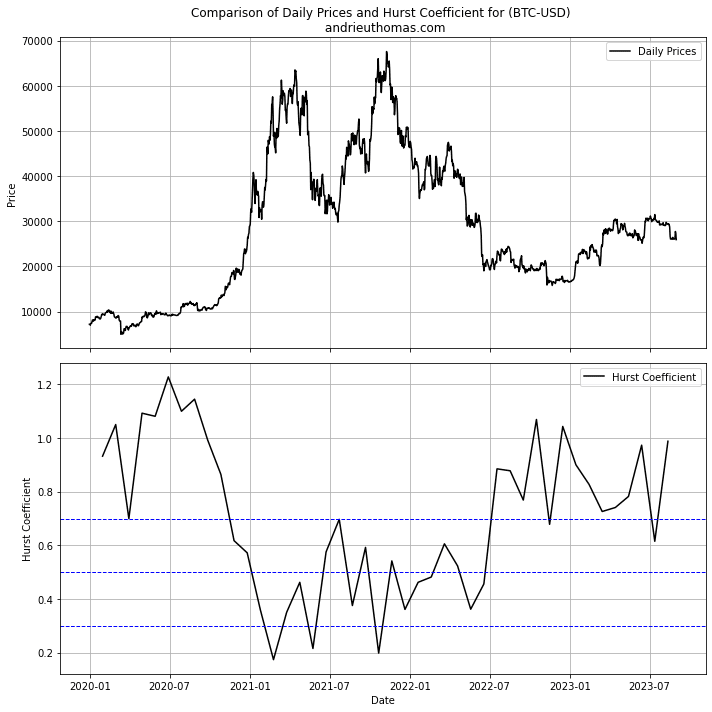
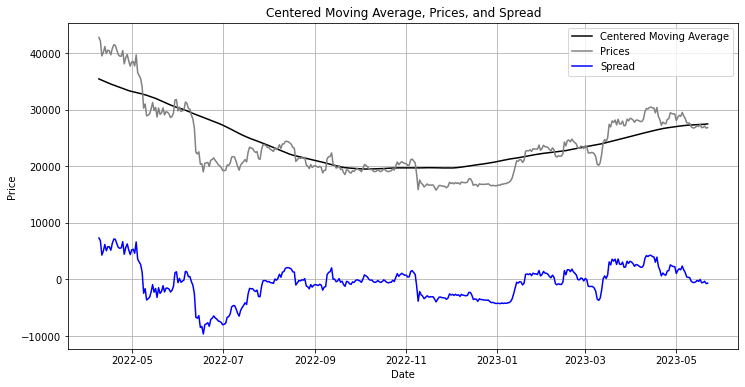
The graph below shows the bitcoin price (BTC). We can see that the drop in August pushed the BTC price down to June levels. All in all, it’s been a dull, neutral summer for cryptocurrencies. But since January 1, 2023, the bitcoin price has continued to rise by over 50%. It’s worth remembering that 2023 marks the end of the bear market of 2022 (up to -75% from the highs). This summer 2023 lateralization is therefore a gamble for cryptocurrency investors: continuation of the 2022 decline or genuine bullish recovery?
It is also noteworthy that January 2023 performed exceptionally well (+40%). Similarly, November 2022 had been catastrophic (-16%), marking the bear market’s capitulation. This also ran counter to the seasonality observed in recent years. In any case, some of the arguments and indicators put forward give us a certain probability for bitcoin’s evolution in 2024.
A trend weakened earlier than expected
As early as July 2023, we warned of the possibility of BTC falling back into the $25,000-$26,000 range. And it did. Maintaining this zone is absolutely crucial, as the long-term moving averages have once again been broken to the downside. The 200-week moving average is now close to $27,600. This level was tested during the week of August 28, but failed again.
Ultimately, we have shown that bitcoin’s surprising decline can be managed. The major zone therefore remains the $25,000 to $26,000 range. It’s clear that the upward trend in bitcoin since January 2023 has been broken. This fall is essentially due to the fall in stock market indices, the return of instability to the latter, and liquidation mechanisms. The suddenness of this movement could lead to reversals, but nothing is certain at this stage. What’s more, the situation is not yet critical. The appeal remains in terms of volumes, volatility and trend persistence. But it is clear that this movement is inducing doubt in investors who might otherwise have appeared over-optimistic.
Bitcoin (BTC) downturn: Turnaround or correction?
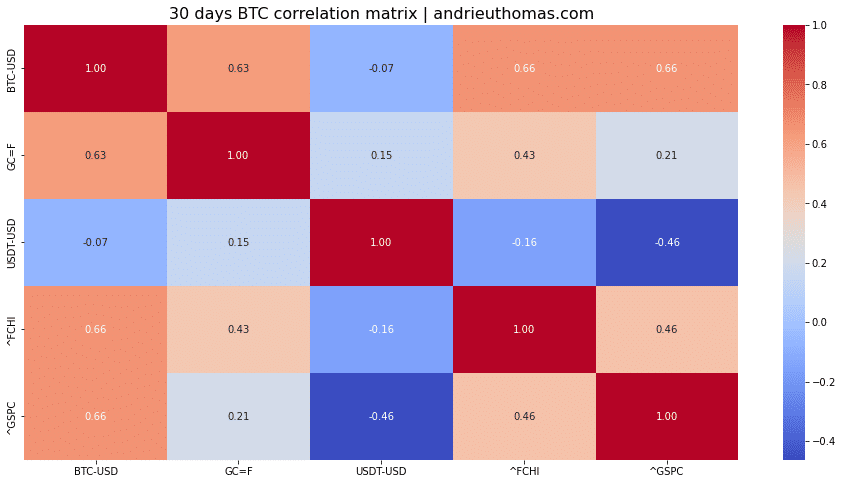
Moreover, since January 1, 2023, bitcoin has been relatively correlated with the S&P 500 or the CAC 40. But this correlation remains lower than the long-term one. Furthermore, we note the absence of correlation with the evolution of the dollar, which has nonetheless influenced the rebound of stock market indices. As a result, we can safely say that bitcoin is partly supported by the stock market rebound. Consequently, we’d need some reassuring economic or financial news to expect a potential bull market.
Moreover, bitcoin’s lows are often accompanied by a minimum correlation with index volatility. The bitcoin price would therefore need to be relatively independent of index volatility over September to confirm a potential rebound. In any case, further bearish weakness would be highly detrimental to the bitcoin price in the long term (Bitcoin (BTC) downturn: Turnaround or correction?).
Bitcoin struggles to regain volatility…
“Without rising volatility, bitcoin can’t rise”, say the statistics. Indeed, in August, bitcoin’s decline was followed by a sustained drop in volatility. So, in the case of bitcoin, we see a lack of interest in the market. Nevertheless, over the past few weeks, bitcoin’s volatility has risen again, to almost 30%. Although this increase is not sufficient, it does tend to support the hypothesis that the price of bitcoin (BTC) will remain stable.
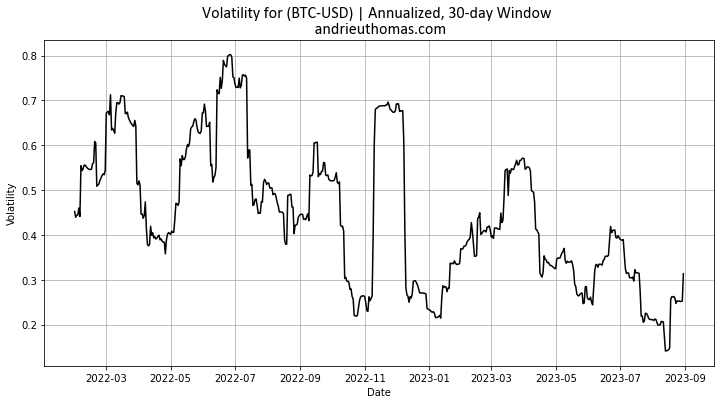
But it’s clear that in order to see a sustainable bitcoin rebound, bitcoin’s volatility would have to increase between now and the end of 2023. The fractals also show that volatility is generally weak. A return of volatility on a daily basis would confirm the market’s recovery. The Hurst coefficient for bitcoin remains high (close to 1). This suggests that, barring a more sustained bear market, major supports may persist.
Finally, the chart below shows the bitcoin price against its 200-day moving average. From this point of view, the bitcoin price remains close to “normal”. Consequently, if the trend remains bearish for a few weeks, the hypothesis of a bullish rebound cannot be ruled out at this stage.
Conclusion
All in all, we have shown that seasonality could still have a negative impact on September. August has raised doubts about the trend set in motion since January. A downturn in bitcoin between now and the end of the year would cancel out the rebound generated since January 2023. September is often a negative month, but it is usually followed by an upward trend. But there are exceptions to this general rule. What’s more, the bitcoin price trend has already weakened, and the bitcoin price remains between $25,000 and $26,000. Moreover, bitcoin’s correlation to most markets seems to be weakening. Confirmation of this would be rather favorable. But, on the other hand, we know that bitcoin peaks are often symmetrical with a minimum of index volatility. Any financial worries would therefore be detrimental to BTC, and could ultimately trigger a more persistent downward dynamic. If August’s decline remains under control, a dismal September would be very negative for the future. Conversely, a return to $27,600, then $30,000 and beyond, would be confirmation of a sideways movement, and potentially of a more sustainable bullish recovery between now and 2024.
Maximize your Cointribune experience with our "Read to Earn" program! For every article you read, earn points and access exclusive rewards. Sign up now and start earning benefits.

Author of various books, financial and economics editor for many websites, I have been forming a true passion for the analysis and study of markets and the economy.
The views, thoughts, and opinions expressed in this article belong solely to the author, and should not be taken as investment advice. Do your own research before taking any investment decisions.