Quelle est la relation entre bitcoin et volatilité ?
— Thomas ANDRIEU (@ThomasAndrieu_) June 2, 2023
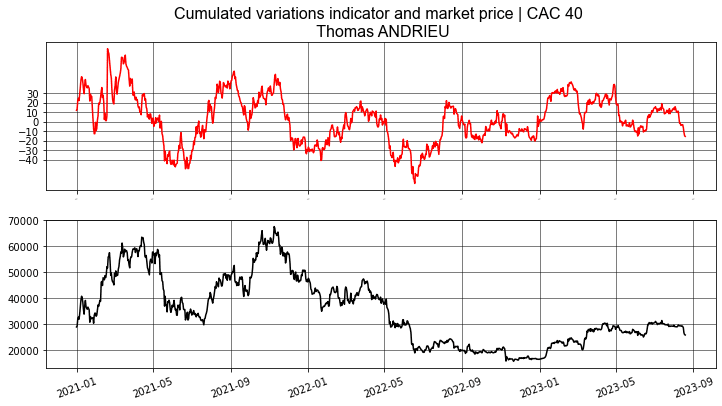
✅A long terme, la volatilité du BTC se réduit.
✅Les maxima du BTC sont accompagnés d'un minimum de volatilité des indices.
✅Les minima du BTC sont accompagnés d'un minimum de corrélation avec la volatilité des indices. https://t.co/MFWzfZIAdP pic.twitter.com/OpWGjKJ9F0
A
A
Bitcoin (BTC) downturn: Turnaround or correction?
Wed 23 Aug 2023 ▪
10
min read ▪ by
Learn
▪
Summarize this article with:
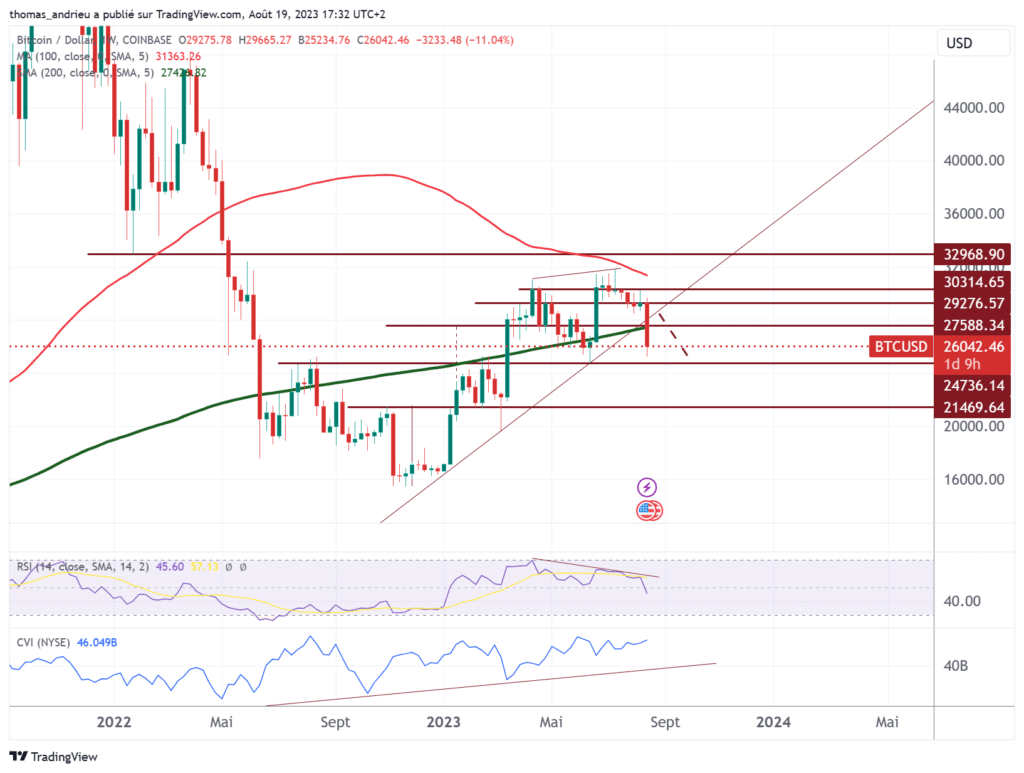
Over the week of August 14, the bitcoin price fell by almost 12%. This turnaround was all the more dramatic as major thresholds that could have inspired long-term confidence were broken. The price of bitcoin fell below the $26,000 mark. It had stabilized above this level since March 2023. In our previous analysis in July, we pointed out that “the $26,000 area appears to be a major zone at present, and the absence of a recovery in volatility on traditional indices will probably determine the next move”.

Factors that predicted the fall
A month ago, we pointed out that “August and September can be months of stagnation and correction. We will therefore be particularly vigilant to ensure that the end of summer does not put an end to the trend observed since January”. Thus, seasonality and the weaker trend prompted us to be cautious. Even so, market activity in July 2023 was significant.
As a result, the bitcoin (BTC) price trend could diverge from what has actually been observed since January 2023. We have seen that several elements indicate that a move by bitcoin below $26,000, and more durably below $25,000, could lead to a break of the trend towards $21,000 or $20,000. Under these conditions, we need to ensure that the buying force is well supported during the summer of 2023. Failure to do so would reduce bullish potential over the coming months.
The major challenge for bitcoin now is to hold above the $25,000 and $26,000 levels. Failing that, we’d be looking at a more strongly bearish signal. In addition, the 200-week moving average is above $27,000. Without a return to this level, the medium-term downside risk is bound to be higher. Indeed, this moving average has never been crossed sustainably to the downside since at least 2015. Bitcoin’s sustained stagnation around $30,000 in recent weeks prompted great caution. But the lateralization hypothesis remains the clearest.
How strong is the Bitcoin (BTC) trend?
First, it is important to note that the strength of bullish variations has been diminishing since the start of the uptrend in February 2023. Furthermore, despite an attempted correction in June 2023, the market has partially regained buying strength. Last week’s correction clearly shows a weakening of the medium-term trend. We can state with little doubt that the uptrend initiated in January 2023 has been broken.
Even so, there’s no evidence of a downtrend, and above $25,000 to $26,000, we’re in the lateralization phase. This price level is still almost 60% higher than it was on January 1! We’d need a 40% drop to get back to the major low of 2022.
A decline on all markets
To better understand whether BTC’s decline is a decline in itself, or a decline induced by other markets, we turn to the study of correlations. Over the past month, bitcoin’s correlation is very strong with all markets except the dollar. Bitcoin is more than +60% correlated with the price of gold and the CAC 40. Similarly, the correlation exceeds +70% in the case of the S&P 500.
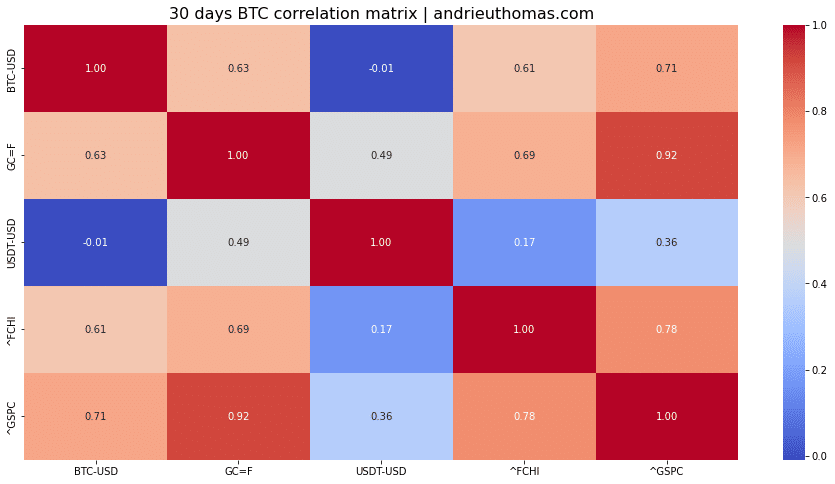
In fact, it’s fair to say that it’s been a particularly negative week for stock market indices. The price of gold fell by nearly 1.2% over 7 days. This has pushed gold back to the major threshold of $1880 an ounce. Preservation of the $1800 mark appears to be a major challenge. For its part, the S&P 500 lost almost 2.5%. Lastly, the MSCI World far world index fell by almost 2%. Clearly, the bitcoin price is reacting mechanically to other markets. Traders seem to be liquidating part of their market positions.
Fractals show reluctance
However, a closer look at fractals reveals a more interesting reading. For the record, fractals measure the degree of persistence of a trend. In the case of BTC, high trend persistence often heralds the end of the trend. Last month, it was possible to observe a potentially bullish signal. But this was overturned this month.
“The move below the Hurst exponent below the 0.7 level is a clear positive signal. It is equivalent to the signal observed in October 2020.”
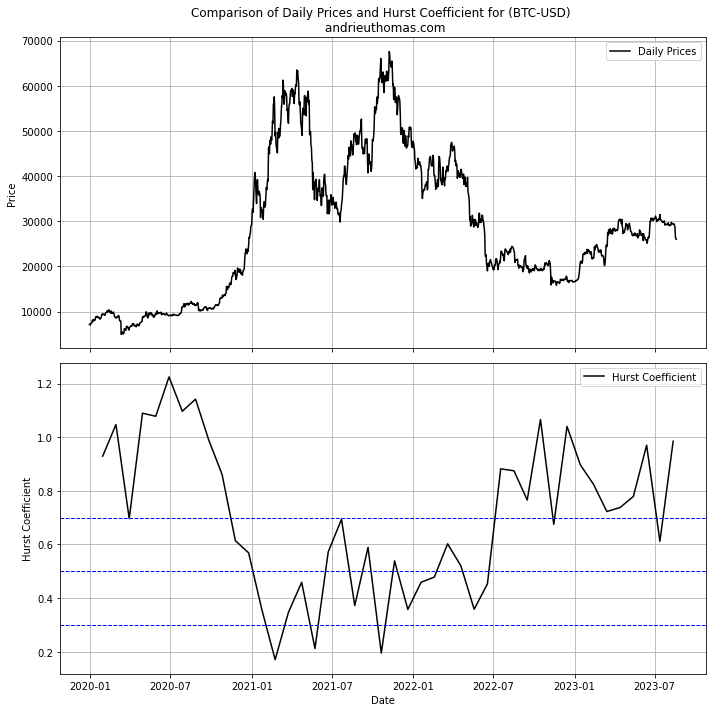
Even so, we feel it’s important to point out, from a fractal perspective, that the potential for a further decline is relatively smaller. Indeed, the persistence of the downtrend since 2022 remains. Consequently, the rise in the Hurst coefficient would primarily reflect the persistence of a downtrend. However, the violence of the decline indicates, as is often the case, “anti-recurrences”. In other words, the trend could stabilize quite abruptly.
Solid supports?
It’s not easy to say whether this fall alone is enough to trigger a bear market. However, a number of factors tend to show that, while the bull market’s strength has been annihilated, the situation is still under control. Indeed, we note that the recent decline marked the downward break in the trend observed since January. By virtue of the pendulum principle, a first technical target for this breakout would be located at around $25,300, which effectively corresponds to the latest low at present.
We’d like to remind you that a bitcoin maintained above $25,000 is still in a good position. What’s more, the decline in bitcoin is not accompanied (for the time being) by a fall in the cumulative volume index (volumes proportionate to the change over the period). As a result, the market is not in a bearish abyss, although we are witnessing the validation of a quasi bearish divergence since May.
Index volatility at work
We know that market extremes are often synonymous with volatility movements. Indeed, market lows are often accompanied by minimal correlation with index volatility. And bitcoin’s major peaks are often the result of minimal volatility. This is probably what we’re witnessing today.
The S&P 500 Volatility Index (VIX) alone has climbed +35% since the end of July. It’s clear, then, that the return of volatility to the markets is probably the reason for such a plunge. Bitcoin’s movements would have to be independent of the instability of the indexes to probably herald an upward turnaround. For the time being, however, any instability in the indices will be detrimental to the price of cryptocurrencies.
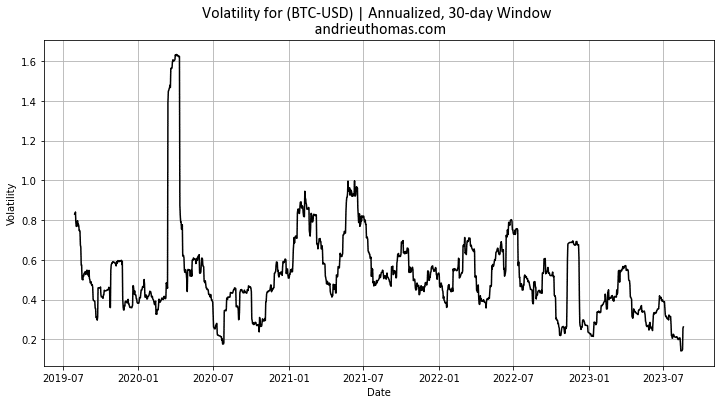
It’s also noteworthy that bitcoin’s volatility is historically low! BTC’s historical 30-day volatility stands at almost 25%, which is absolutely comparable to stock market indices. Bitcoin’s low volatility often limits downside potential, as bitcoin’s rise often begets a rise in volatility. The fact that bitcoin’s volatility is rising at the same time as it is falling is also an anomaly.
In conclusion
Ultimately, we have shown that bitcoin’s surprising decline can be managed. The major zone therefore remains the $25,000 to $26,000 range. It’s clear that the upward trend in bitcoin since January 2023 has been broken. This fall is essentially due to the fall in stock market indices, the return of instability to the latter, and liquidation mechanisms. The suddenness of this movement could lead to reversals, but nothing is certain at this stage. What’s more, the situation is not yet critical. The appeal remains in terms of volumes, volatility and trend persistence. But it is clear that this movement is inducing doubt in investors who might otherwise have appeared over-optimistic. The difficulty in breaking through the $30,000 zone in recent weeks has confirmed, in addition to statistical exhaustion, the market’s reversal. Entry into a sideways market is therefore subject to two options. September’s seasonality prompts us to be cautious, although there’s nothing very alarming at the moment.
Maximize your Cointribune experience with our "Read to Earn" program! For every article you read, earn points and access exclusive rewards. Sign up now and start earning benefits.
A
A

Author of various books, financial and economics editor for many websites, I have been forming a true passion for the analysis and study of markets and the economy.
DISCLAIMER
The views, thoughts, and opinions expressed in this article belong solely to the author, and should not be taken as investment advice. Do your own research before taking any investment decisions.