Should we brace ourselves for a Bitcoin bull-run?
We are now in the final week of the year. A difficult time for the crypto industry. BTC, the leader in terms of market capitalization, has indeed plunged by 64%. However, multiple bullish patterns are emerging on the price of this crypto. This could signal an incoming bull-run on bitcoin next year. Read more about this analysis.

Several bullish signals regarding Bitcoin (BTC)
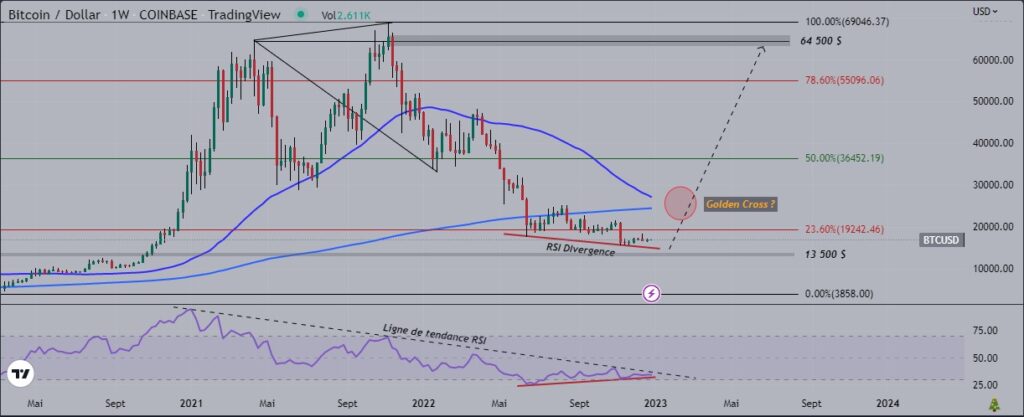
Several bullish signals can indeed be seen on the weekly chart. These are relevant signals, as they are on a long-term scale. Thus, because of these patterns, we can expect a 215% bullish rally next year. Without further ado, let’s talk about these bullish signals appearing on the Bitcoin (BTC) chart.
First, there is the RSI divergence. Indeed, since June 12, the price of BTC has made lower and lower lows. While, during the same period, the RSI has been making higher and higher lows. This indicates that buyers are beginning to fight back, and are gaining strength. In addition, there is also a trend line on this oscillator. This line has already been touched three times. Thus, it could mean that the fourth touch will be a breakout. Then there is also the impending crossing of two moving averages, the MM50 and the MM200. This crossing, dubbed “Golden Cross”, is a very relevant reversal signal. Therefore, once these two moving averages cross, there is a chance that the price of bitcoin (BTC) will experience a long-term bull-run.

Two main obstacles
Despite these major bullish setups, there are two main obstacles for buyers. The first being the zone around $47,300, which has acted as a critical resistance this year. Indeed, after approaching this level in March, bitcoin (BTC) fell 65%. Therefore, this level should not be overlooked. The second major obstacle is a little higher, at $64,500. For a supporter of the SND strategy, this level is very relevant. Indeed, this is a “quasimodo”, or in the language of traders, a “shoulder”. Thus, it is possible that the price will form an Head and Shoulders pattern once it reaches this zone.
Based on all these signals, it seems that bitcoin is ready for the next bull run. However, buying right now may be risky. Indeed, the price could hit the bottom on the $13,500 support before the bullish rally.
Maximize your Cointribune experience with our "Read to Earn" program! For every article you read, earn points and access exclusive rewards. Sign up now and start earning benefits.

The views, thoughts, and opinions expressed in this article belong solely to the author, and should not be taken as investment advice. Do your own research before taking any investment decisions.