Solana: Technical Analysis and Consolidation Outlook — October 17, 2025
Solana is experiencing a marked correction phase after the break of a key support, in a market context dominated by Bitcoin’s decline. Discover the technical outlook for the future evolution of SOL.

In brief
- Technical analysis: Marked pullback below $200, in a context of technical correction after a prolonged bullish excess.
- Technical levels: Major support at $170; resistance at $237 then $253, possible reversal zones.
- Derivatives analysis: Reflux of speculative positioning, selling dominance on flows, massive liquidation on longs.
- Forecasts: Fragile market — maintaining above $170 supports a bullish scenario; break would open a corrective phase towards $156 or even $126.
Technical analysis of Solana (SOL)
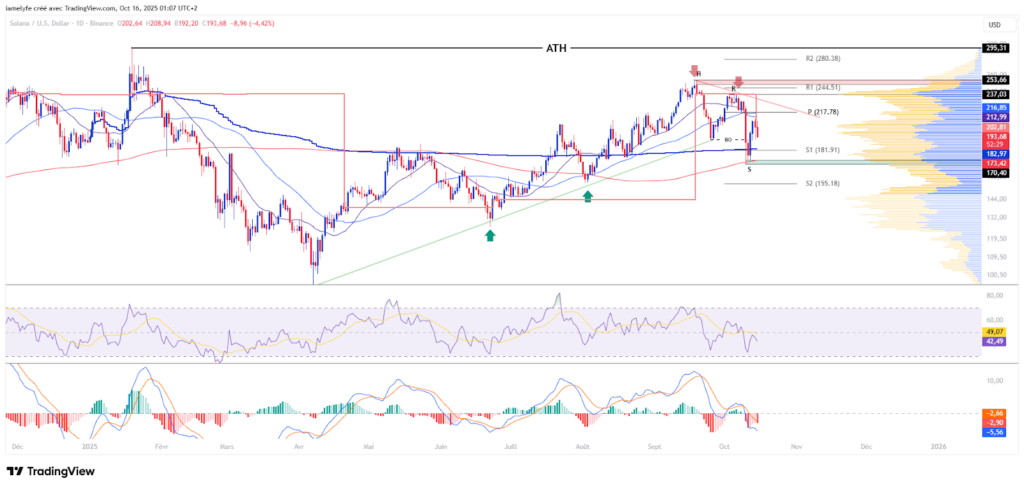
The spot price of Solana is trading around $194, marking a weekly decline of about 14%. This fall follows Bitcoin, triggering a widespread pullback in the crypto market. However, spot volumes rose by +47% to $14.8 billion, showing increased trading and renewed activity during the correction phase.
In the long term, the 200 SMA confirms a bullish dynamic, with the market maintaining an underlying upward structure. In the medium term, the 50 SMA stabilizes, suggesting a waiting phase between buyers and sellers. Conversely, the 20 SMA turns bearish, marking a loss of momentum. Oscillators confirm this reversal with downward momentum, signaling a weakening of buying pressure.
Technical levels Solana (SOL)
The market now trades below major resistance levels at $237, $253, and then $295 (ATH), zones likely to act as distribution thresholds in case of limited recovery. On the downside, key supports stand at $170, $156, and then $126, representing potential accumulation zones where a rebound could begin. The daily break of the $190 support confirms a short-term structural weakening. The monthly pivot point at $217 remains above the current price, validating a negative technical bias. The volume profile shows a high-value area at $237 and a low-value area at $244, framing an equilibrium zone whose break could trigger a new episode of volatility.
The current technical analysis was carried out in collaboration with Elyfe, investor and popularizer in the cryptocurrency market.
Derivatives analysis (SOL/USDT)
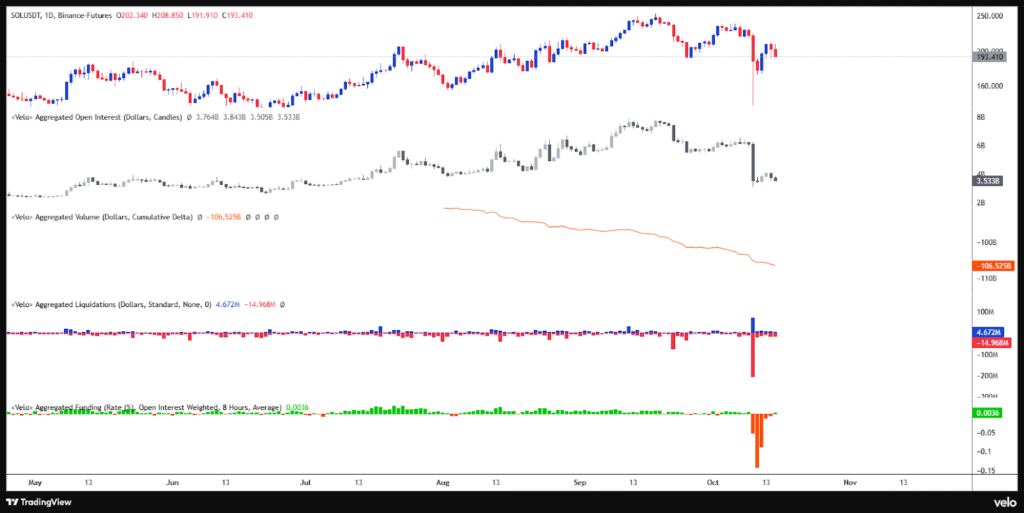
Derivative indicators reinforce the idea of a retreating market. Open interest is decreasing, signaling a disengagement of speculative positions. The CVD highlights selling dominance, illustrating capital flows mainly oriented to selling. Massive liquidations recorded on long positions confirm a leverage purge after the recent pullback. The funding rate, neutral again after a brief negative phase, reflects a market rebalancing without excessive pressure on either side.
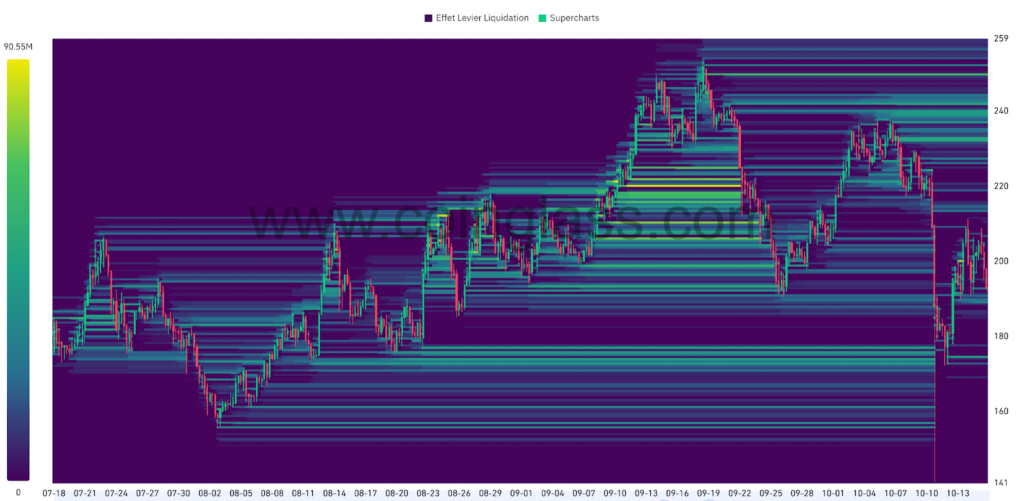
The selling liquidation zone, between $230 and $250, appears as a critical threshold: a break above could strengthen bullish momentum due to squeeze effect but also serve as a distribution zone if the market remains fragile.
Conversely, the buying liquidation zone, located between $190 and $174, remains vulnerable: a break below these levels could accelerate the decline while representing an interest point for strategic accumulation.
Forecasts for Solana price (SOL)
Bullish scenario:
- Conditions: Maintain above support at $170.
- Targets: $210 / $237 / $253 then $295 (ATH).
- Potential: Around +52% from the current level.
Bearish scenario:
- Conditions: Break of support at $170.
- Targets: $156 / $126 / $95.
- Potential: Approximately –51% from the current level.
Conclusion
Solana enters a consolidation phase after a marked correction. The underlying structure remains bullish, but short-term dynamics weaken, supported by visible disengagement in derivatives markets. The $170 threshold now stands as a critical pivot for the trend’s future.
In this context, it will be essential to closely monitor price reaction at strategic levels to confirm or adjust current forecasts. Finally, remember that these analyses are based solely on technical criteria, and cryptocurrency prices can evolve rapidly due to other more fundamental factors.
Did you find this study interesting? Find our latest Bitcoin analysis.
Maximize your Cointribune experience with our "Read to Earn" program! For every article you read, earn points and access exclusive rewards. Sign up now and start earning benefits.

Spécialiste en analyse technique, Elyfe décrypte les tendances graphiques des marchés des cryptomonnaies avec une approche rigoureuse et en constante évolution. À travers ses analyses détaillées, il apporte un regard éclairé sur la dynamique des prix, aidant les investisseurs et passionnés à mieux comprendre et anticiper les mouvements du marché.
The contents and products mentioned on this page are in no way approved by Cointribune and should not be interpreted as falling under its responsibility.
Cointribune strives to communicate all useful information to readers, but cannot guarantee its accuracy and completeness. We invite readers to do their research before taking any action related to the company and to take full responsibility for their decisions. This article should not be considered as investment advice, an offer, or an invitation to purchase any products or services.
Investment in digital financial assets carries risks.
Read more