Stock market chills: S&P 500 defies gravity while Bitcoin remains in a precarious balance
The U.S. stock markets defy inflation with a persisting climb of the S&P 500 towards 5,000, while the DXY oscillates at a crossroads. Optimism about stable interest rates, according to the FedWatch tool, mixes with a detailed technical analysis of the stock market. Meanwhile, on the cryptographic front, Bitcoin navigates between bullish and bearish waves, creating a tumultuous dance for attentive observers.

American Stock Market: S&P 500 towards 5,000, DXY at the Crossroads
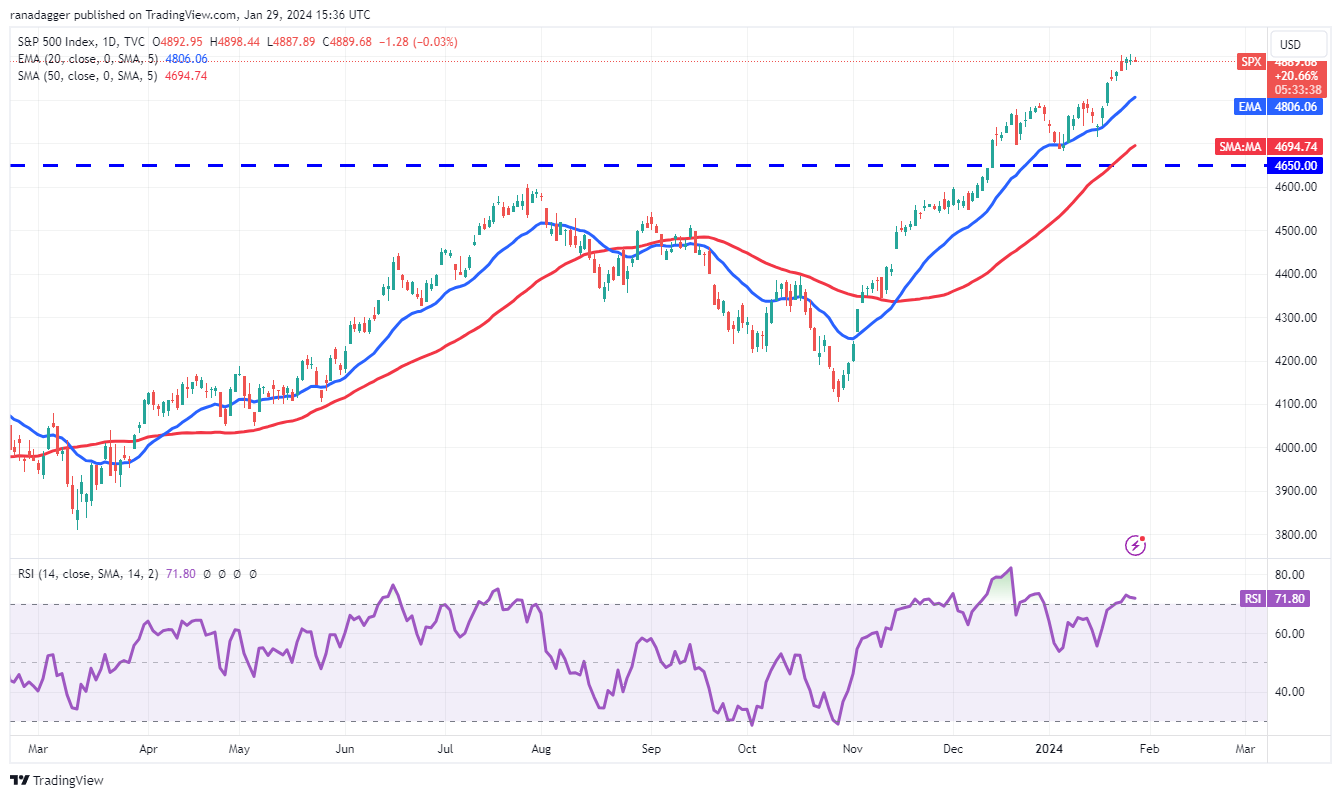
The U.S. stock markets persist in their climb, defying inflation concerns. Despite uncertainties, the FedWatch tool suggests stable interest rates until March. The S&P 500 index, showing a progression of 1.06% last week, is approaching the psychological threshold of 5,000. This rise is encouraged by the prospect of expansionary monetary policies.
Technically, the analysis of the S&P 500 index reveals a resistance at 4,900, but a sustained bullish trend, notes CoinTurk. Buyers aim for 5,000, while a break of the moving average at 4,806 could indicate a deeper correction.
On the side of the US Dollar Index (DXY), despite resistance to the downward trend line, bulls maintain the price above moving averages. The 20-day EMA at 103 and the positive RSI signal upward momentum. A breakthrough of the resistance would drive the index to 104.50 and 106. However, a fall below the moving averages would indicate a strong defense by bears, threatening a drop to 102. Stock markets continue their dance between optimism and caution, making each movement an anticipation for investors.
Bitcoin in Precarious Balance
The recent skirmishes in the Bitcoin exchange reflect a fierce struggle between bulls and bears. On January 28 and 29, buyers attempted to propel Bitcoin beyond the 50-day moving average, set at $42,795. However, bears held firm. Current indicators, such as indecisive moving averages and an RSI near the midpoint, do not give a clear advantage to either side. A breakthrough above the 50-day moving average could propel the BTC/USDT pair to $44,700 on exchanges, likely prompting a strong reaction from bears. Conversely, a reversal at $44,700 and a fall below the moving averages could indicate a continuation of the range-bound movement.
On the other hand, a decline below the 20-day EMA at $41,950 and a sustained hold below this level could lead to a gradual descent to $40,000, and potentially down to $37,980. The next trend movement will depend on whether buyers can push the price above $44,700 or whether bears manage to push the pair below $37,980.
The battle on the Bitcoin front continues, leaving observers alert to the future evolution of this cryptographic battle.
Maximize your Cointribune experience with our "Read to Earn" program! For every article you read, earn points and access exclusive rewards. Sign up now and start earning benefits.

La révolution blockchain et crypto est en marche ! Et le jour où les impacts se feront ressentir sur l’économie la plus vulnérable de ce Monde, contre toute espérance, je dirai que j’y étais pour quelque chose
The views, thoughts, and opinions expressed in this article belong solely to the author, and should not be taken as investment advice. Do your own research before taking any investment decisions.