
Thu 25 Sep 2025 ▪
5 min read
▪
by
He posts a "gm" from his cell, the FTT token soars... and traders applaud! Who said crypto wasn't an open-air theater?
He posts a "gm" from his cell, the FTT token soars... and traders applaud! Who said crypto wasn't an open-air theater?
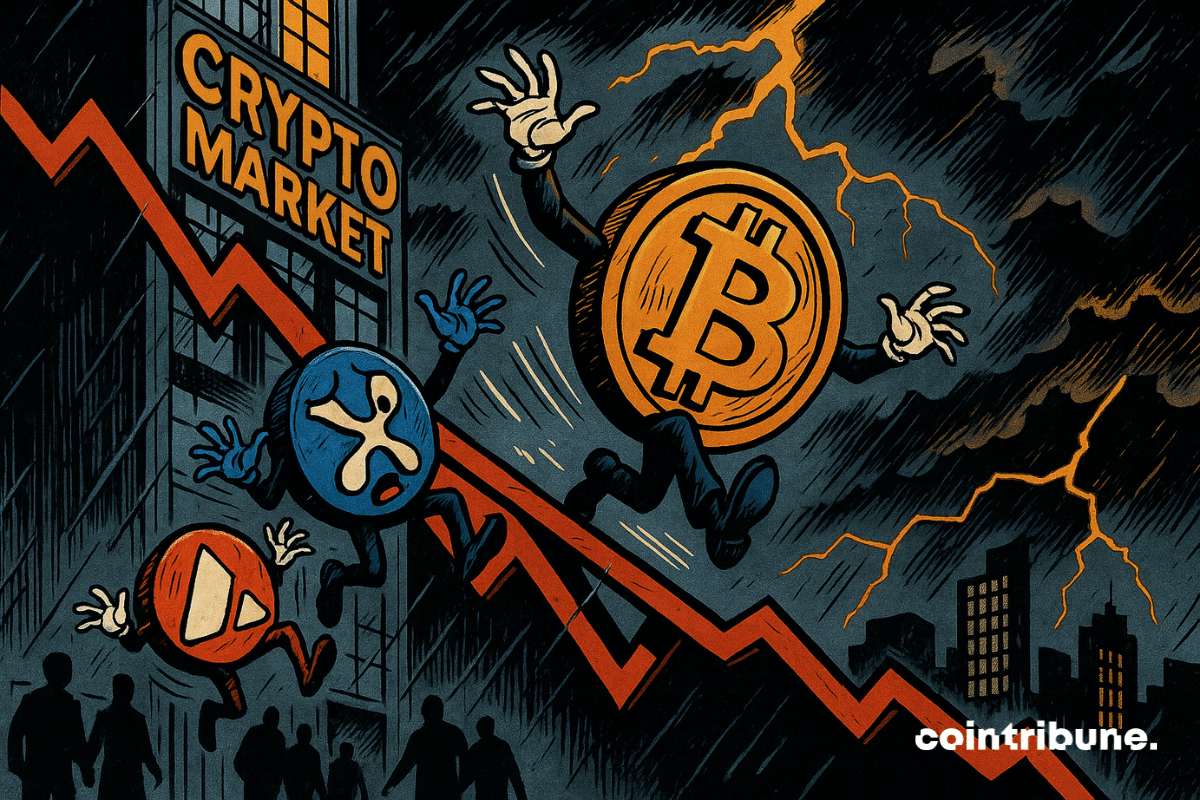
While Bitcoin strengthens its hegemony, XRP awaits a verdict, Avalanche slips, and the crypto-sphere holds its breath: suspense, ETF lurking, and whales lying in wait.
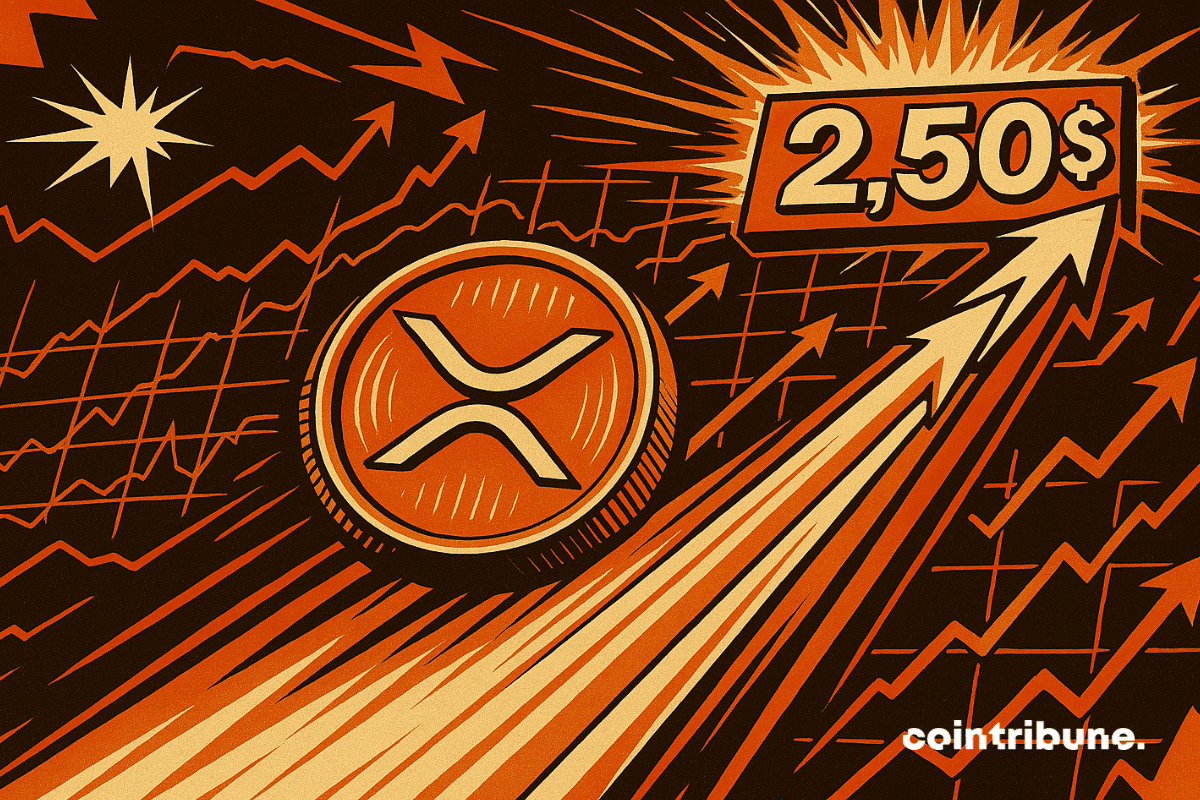
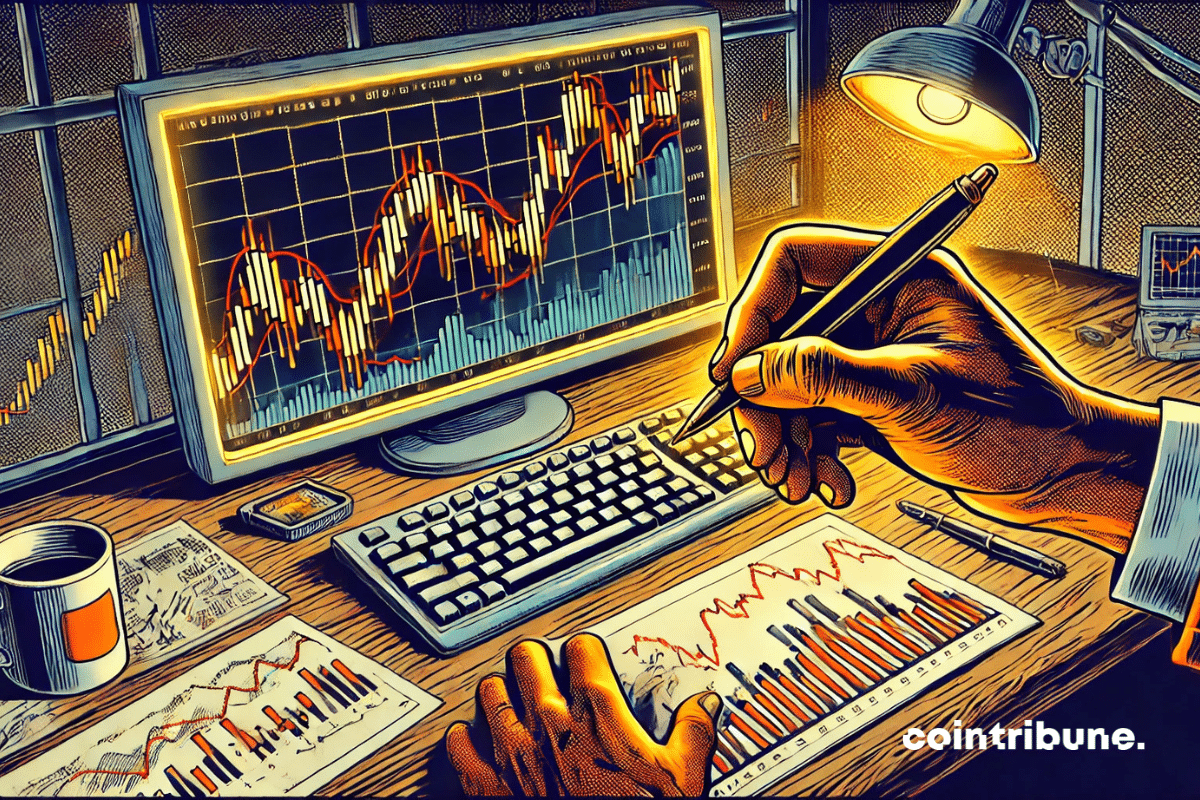
Could XRP initiate a decisive turning point? A rarely observed technical signal attracts analysts' attention: Bollinger Bands draw a setup favorable to a trend reversal. While the market remains volatile and volumes decline, the asset shows signs of resilience above a critical threshold. Enough to revive the interest of seasoned investors, on the lookout for a strategic entry point. Is this movement the prelude to a new bullish cycle or just a simple technical rebound?
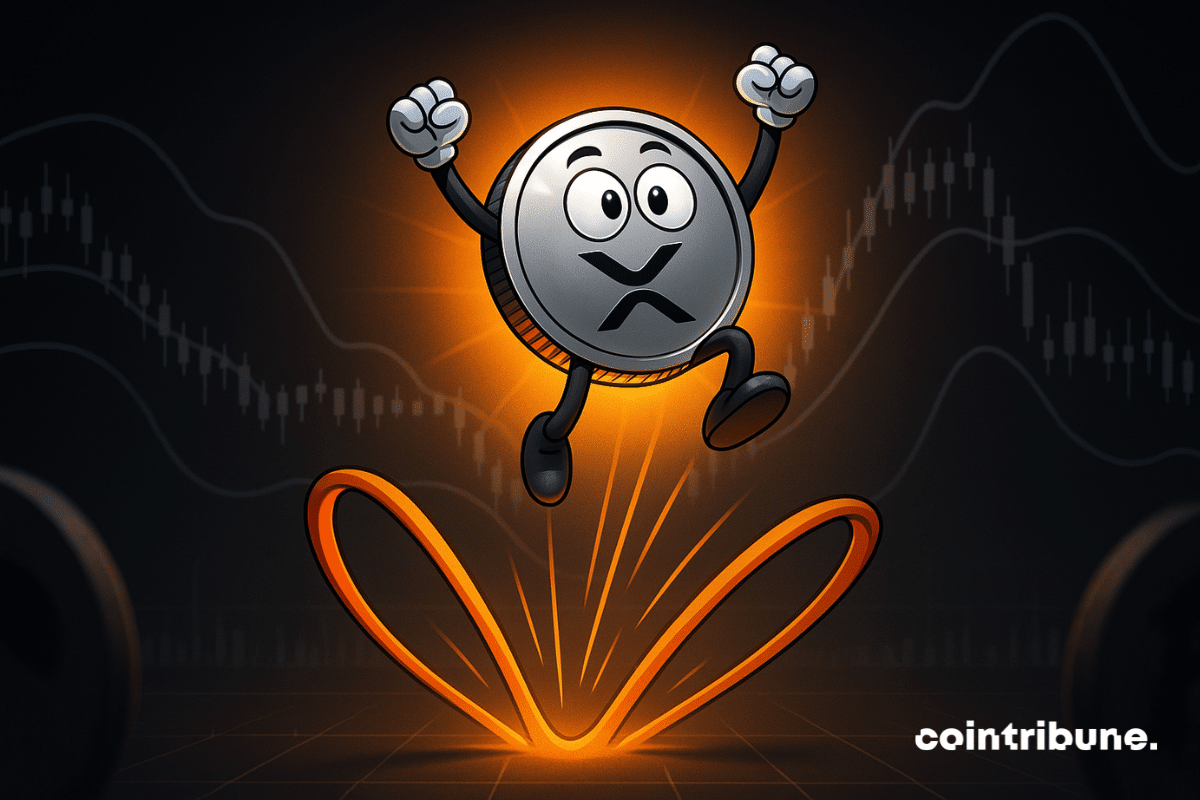
XRP is getting serious again: whales are gorging themselves, the SEC might say yes, and the indicators are flashing green. The market? It's waiting, ready to leap to $3.
XRP, the crypto that was sleeping, is waking up from its digital coma with a jolt worthy of an earthquake, flirting with new heights and landing on traders' radar.
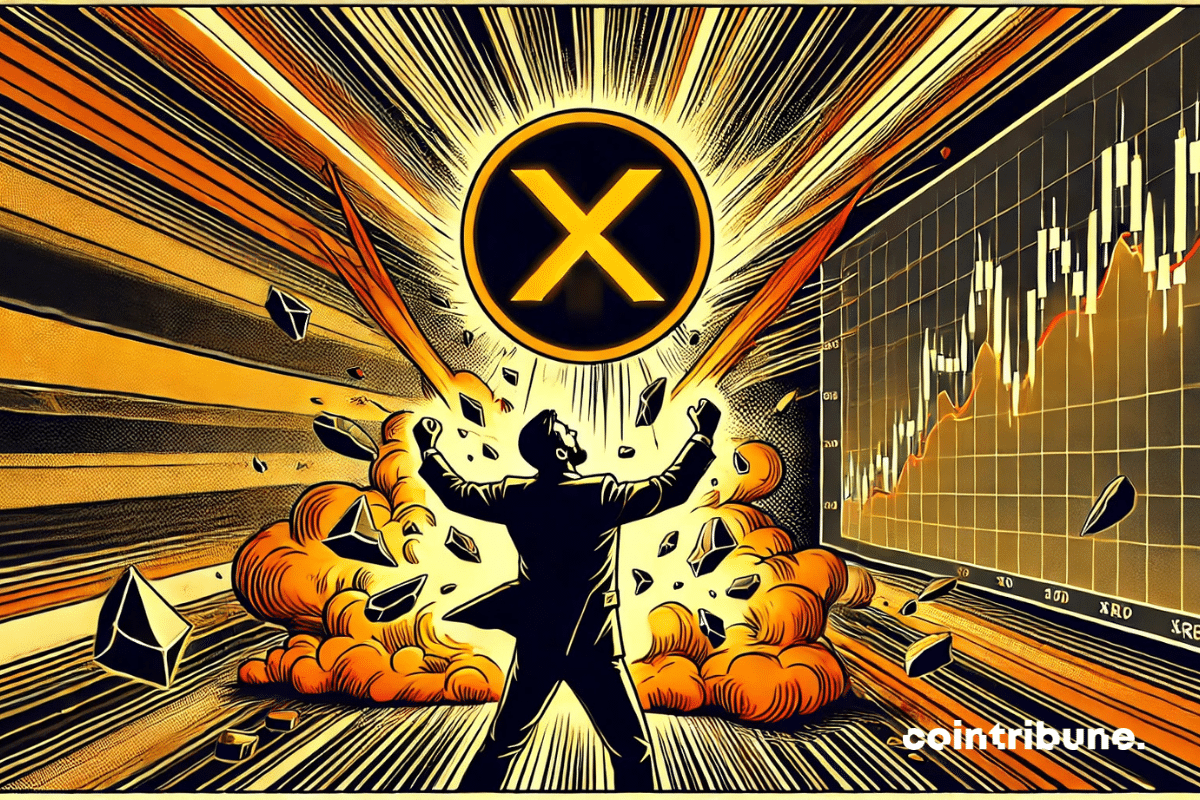
Different technical signals, when they align, act as a silent warning in the markets. This is the case with XRP, whose Bollinger Bands have just tightened to a level rarely observed. Thus, this configuration fuels speculation of a possible rally towards $2.50. In an ecosystem where every indicator can trigger a wave, this movement draws the attention of seasoned investors as well as technical analysts.

Like rats leaving a sinking ship, 605 million dollars in ETH are making their escape. Should we see this as an imminent rebound or a planned shipwreck?

The Shiba Inu is playing hide and seek with traders: a dizzying drop, a rebound in sight, and whales gorging themselves in the background. Ready for the roller coaster?

January was a festival for XRP: 50% increase, regulatory green lights, and a crypto market in ecstasy. But at 4 dollars, does the party continue or will the wake-up call be brutal?
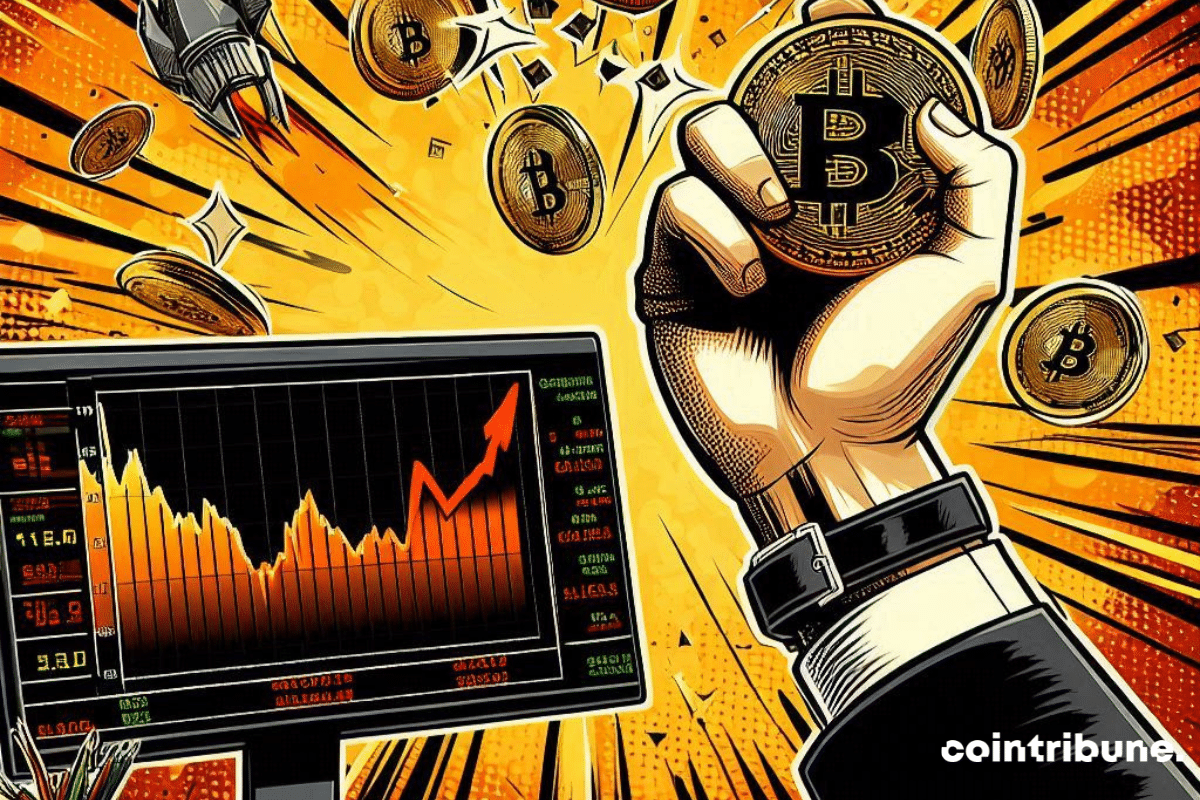
Bitcoin, the tightrope walker of the crypto market, is tightening its margins. A surge of 40% like in 2023 looms in the shadows.
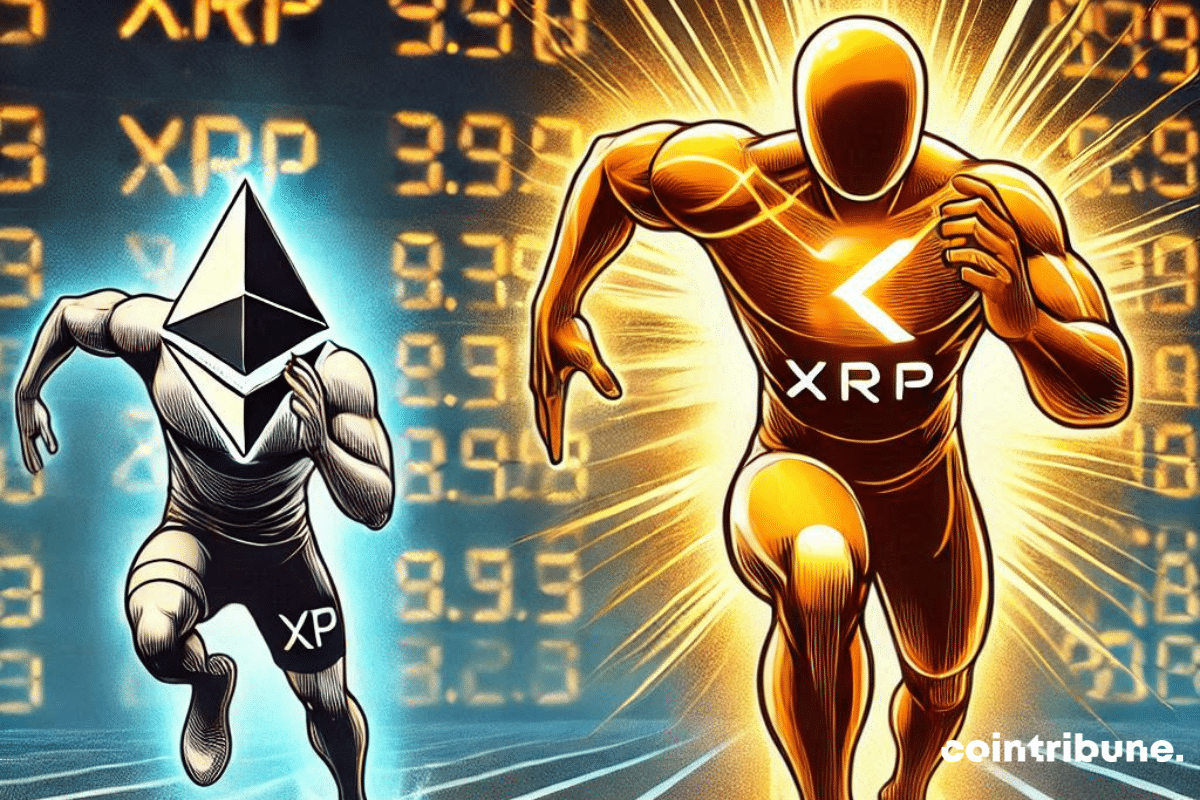
XRP, like a reborn phoenix, is now only 83.4% away from surpassing Ethereum. A spectacular rise that disrupts the hierarchy of giants.
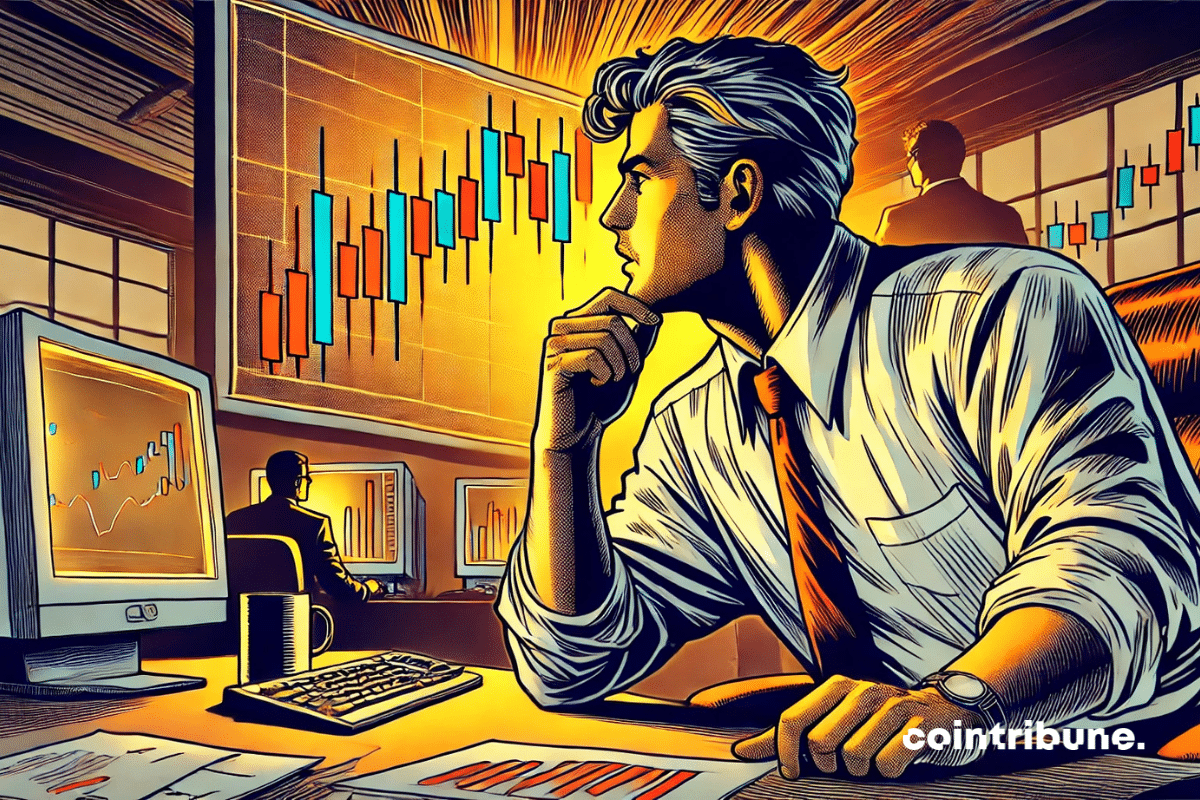
Trading on financial markets requires precise analysis and a deep understanding of market trends. Technical indicators are essential tools in this process. They provide key information to guide trading decisions. However, with the multitude of indicators available, it can be difficult for traders to choose those that best suit their needs and strategies. This article offers a clear guide on the most popular technical indicators, their selection, and optimal usage.
Bollinger bands are a technical analysis tool that provides essential insights into volatility and price trends in financial markets. However, this widely recognized indicator requires a deep understanding to be used effectively. Overview of the specifics of Bollinger bands.

Bitcoin shows signs of increased volatility, with the Bollinger Bands reaching their tightest point in a year.
The crypto signals provided by the Bollinger Bands suggest an upcoming phenomenal price increase for Ripple(XRP)!
Just like previous cycles, the price of Bitcoin experienced a correction corresponding to the Fibonacci ratio of 0.618, around $48,000. Nothing new at this stage. Traders now need to focus on the Bollinger bands to determine the next step.