Volatility and Bitcoin (BTC)
Volatility is a peculiar topic in the world of finance, and even more so in the world of crypto. Indeed, volatility can be analyzed from two perspectives. On one hand, it allows us to measure the likely variations of an asset and, in some cases, anticipate its movements. On the other hand, the overall volatility of assets reveals which ones truly benefit from periods of tension. In this article, we will focus on a historical volatility approach.
Historical volatility of Bitcoin (BTC)
Studying volatility brings to light mechanics, paradoxes, oppositions, or complementarities between assets. The case of Bitcoin is quite unique, both in terms of the intensity of its volatility and its predictive capacity.
A singular behavior
In a previous article, we discussed the volatility of Bitcoin. Volatility measures the instability of price variations of an asset. Bitcoin exhibits a distinct behavior in relation to volatility, and we highlighted the following conclusions:
“Generally, we observe that Bitcoin’s volatility increases during phases of price growth. Conversely, a decrease in the price of Bitcoin is usually accompanied by a decrease in volatility. In other words, extreme variations in Bitcoin are more significant during market upswings.”
Indeed, as shown in the following graph, there is a downward trend in Bitcoin’s volatility rate (BTC). In 2018, Bitcoin’s annualized volatility was close to 90%. In 2023, this volatility is around 65%, representing a decrease of more than 26 volatility points in just 5 years. This decline in volatility also reflects, in line with the aforementioned observation, that the upward (and downward) performances of each new Bitcoin cycle are weaker.
This means that Bitcoin has lost as much volatility in five years as the CAC40’s volatility!
Historical volatility
The graph below illustrates the evolution of Bitcoin’s price (BTC, dotted line). Additionally, we have added (in blue, continuous line, right axis) the annualized volatility of Bitcoin based on monthly price data. The red trendline shows us the long-term trajectory of Bitcoin’s volatility. Once again, we observe the complexity of the relationship between Bitcoin and its volatility.
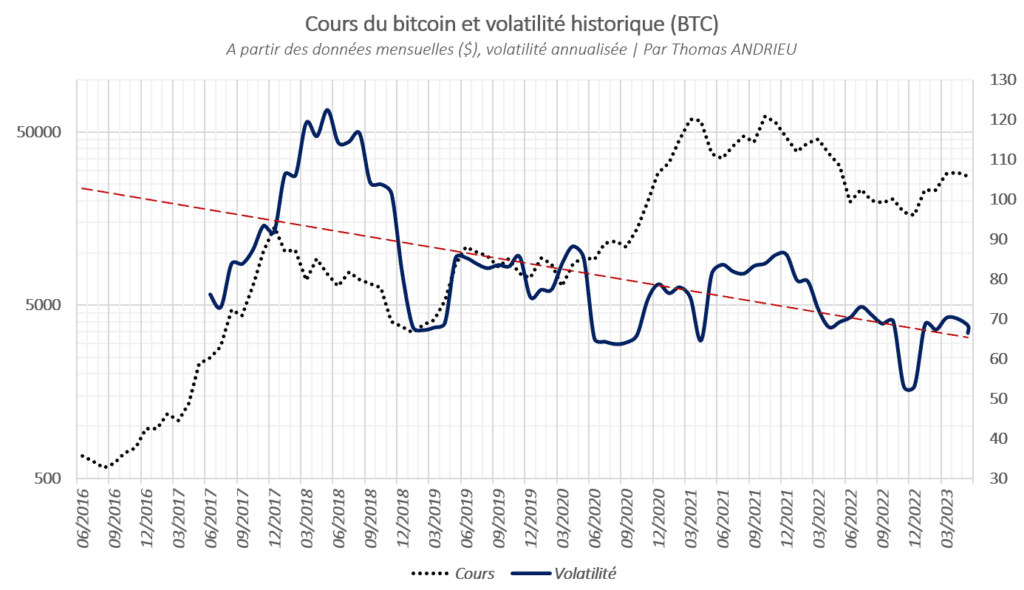
- Long-term correlation between Bitcoin’s price and volatility is negative (-25%). In other words, a decrease in long-term volatility is more or less accompanied by an increase in Bitcoin’s price.
- On a one-year basis, the average correlation between Bitcoin’s price and volatility is positive (+28%). This means that an increase in volatility generally leads to a short- or medium-term increase in Bitcoin’s price.
These statistical observations are also reflected graphically. We can see that trends in Bitcoin’s price are often linked to symmetrical movements in volatility. Even the major low observed in November 2022 was accompanied by a historical low in volatility!
A recent strong increase in the link between volatility and Bitcoin!
We have shown that the one-year average correlation between volatility and Bitcoin is +28%. However, the correlation rate between these two variables varies extremely. This means that Bitcoin goes through periods of strong correlation with its volatility (sometimes over 80%), followed by periods of weak correlation (sometimes negative). In May 2023, the one-year correlation between Bitcoin’s price and volatility is +53%. This correlation exceeded +70% at the end of 2022 and reached a negative value of -30% in February 2022!
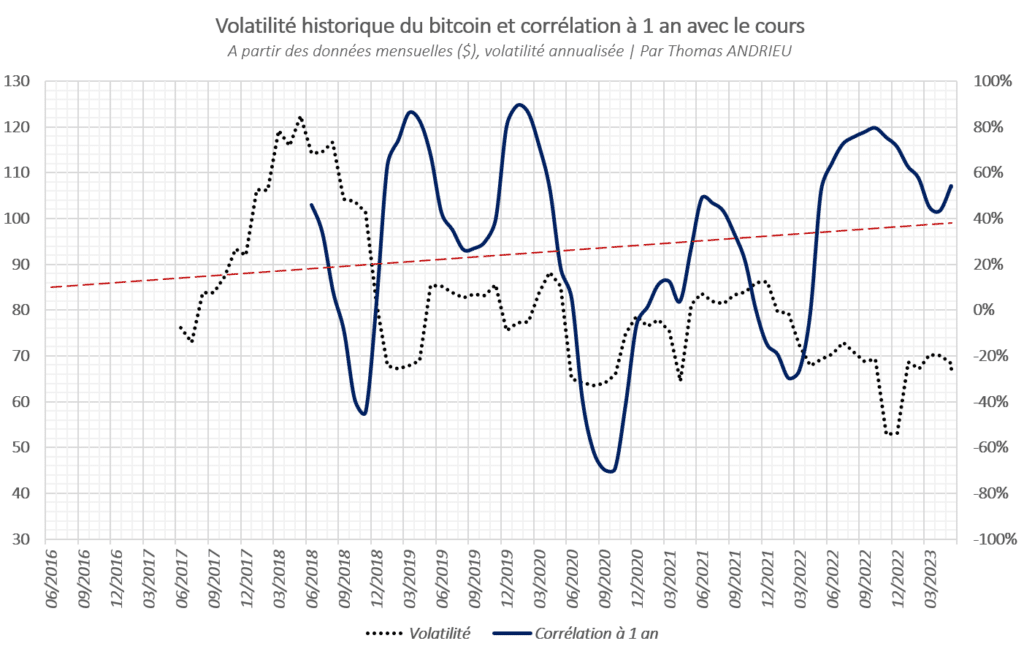
The interesting observation arises when we note the periods of negative correlation between volatility and Bitcoin’s price. September 2018, September 2020, and partially February/March 2022 were extreme negative correlation points between Bitcoin’s price and volatility. Each of these correlation deficits between Bitcoin and its volatility marked, with several months in advance, the market’s bottom or the beginning of a strong upward trend. This observation is important, but it can be refined.
Furthermore, the same logic can be applied to excessive positive correlation. Thus, March 2019, March 2020, July 2021, and November 2022 were extreme points. Except for July 2021 (which is a relative low point), each of these extremes exactly described the absolute market lows! This observation seems more relevant to us. In any case, it is noteworthy that there has been a strong resurgence of the link between Bitcoin and volatility since 2020.
Bitcoin driven by index volatility?
Once we have analyzed Bitcoin’s unique behavior, it is interesting to note its relationships with other assets. We know that the correlation between Bitcoin and stock indices is particularly high, sometimes exceeding 80%. However, the deeper question raised here is about the “safe haven” nature of Bitcoin. The key issue is whether crises in traditional markets can benefit Bitcoin.
A strong relationship with index volatility
The graph below shows the annualized historical volatility of the S&P 500 (continuous blue line). It is calculated from monthly data, which can explain an amplification of short-term calculated volatility. We have also added the Bitcoin price (BTC, dotted black line).
The major conclusion is that the peaks in Bitcoin’s price are synchronized with the lows in index volatility. Furthermore, as early as 2020, we stated the idea that bull markets generally begin with maximum index volatility. This proposition seems to make sense once again. The graph clearly shows that volatility lows are negative signals for Bitcoin.
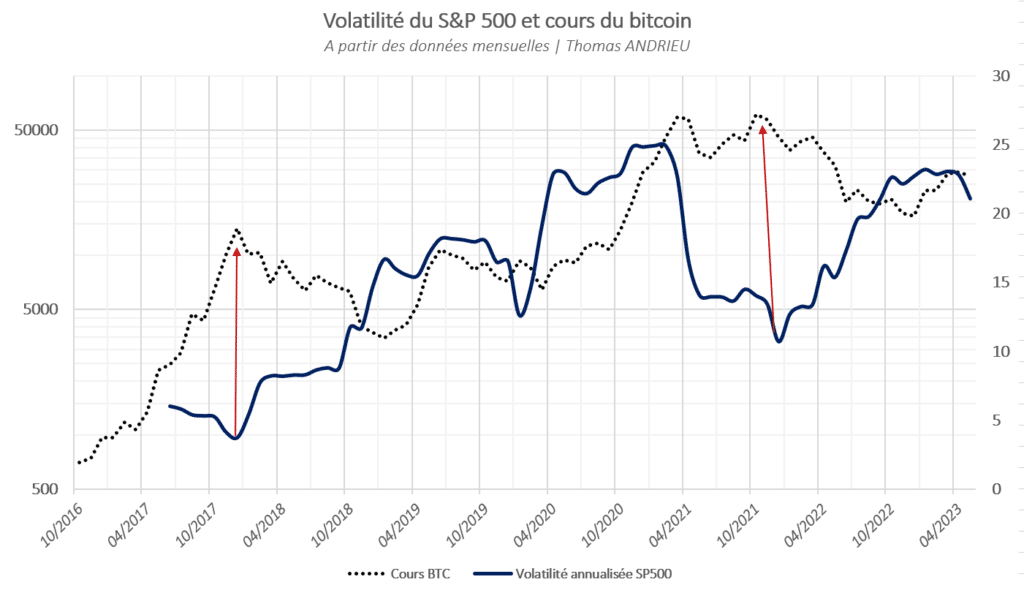
The statistics support these observations. Between 2017 and 2023, the correlation rate between S&P 500 volatility and Bitcoin price is +23%, which is sufficient but not necessary to assert a strong link between the two variables.
But again, the study becomes more interesting in the medium and short term. The one-year correlation between S&P 500 volatility and Bitcoin is on average -16%. It even drops to -90%, as in December 2022! Once again, we have a captivating relationship here.
Extreme behavior in response to index volatility?
We have shown that Bitcoin’s highs are synchronized with volatility lows. But it turns out that Bitcoin’s lows are synchronized with a maximum (opposite) correlation with index volatility! This means that market lows occur inversely to market volatility. A spike in index volatility can, over a few months, signal a Bitcoin price minimum.
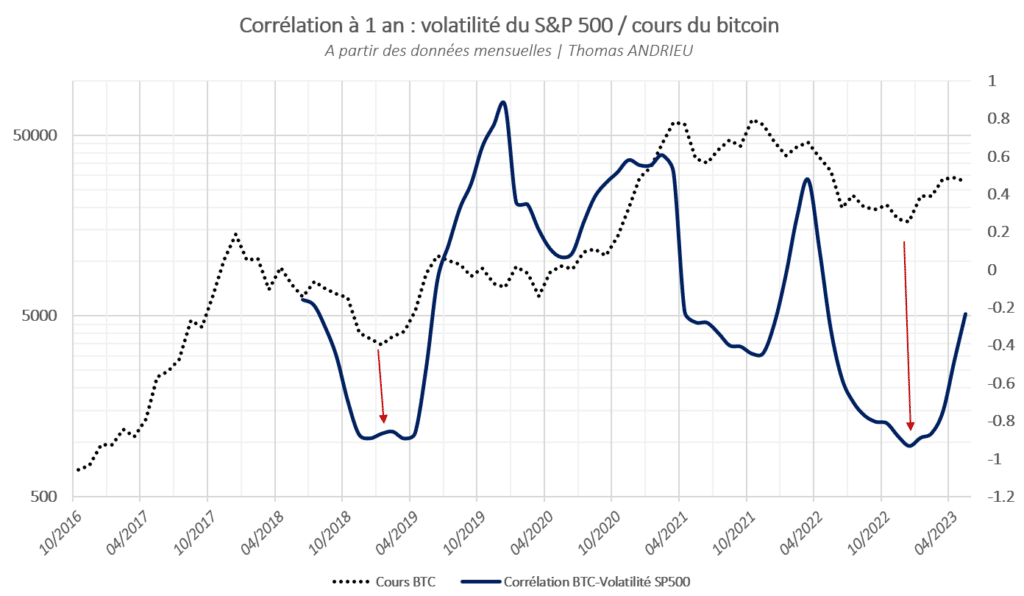
It is truly astonishing to see how intensely Bitcoin opposes or aligns with movements in index volatility. Furthermore, one could also argue that bear markets in Bitcoin are generally symmetrical to a decorrelation with S&P 500 volatility.
Therefore, periods of strong correlation between S&P 500 volatility and Bitcoin are mainly observed at market highs. Nevertheless, it appears clear that an increase in index volatility benefits Bitcoin in the long term. However, this does not necessarily mean that an uncertain environment is favorable for Bitcoin. In the short and medium term, an increase in index volatility can lead to significant declines in Bitcoin.
The relationship we have described is complex but precise enough to be relevant. Comparing Bitcoin to index volatility allows us to estimate both market highs and lows.
In conclusion
In conclusion, we have studied the role of volatility in Bitcoin (BTC). On one hand, Bitcoin’s own volatility reveals counterintuitive yet powerful conclusions. Long-term Bitcoin price increases are generally accompanied by a decrease in volatility. Bitcoin thrives on decreasing long-term volatility. However, over a few months, Bitcoin benefits from increased volatility to boost its performance. A drop in volatility often translates into an immediate decline in Bitcoin’s price. Additionally, the volatility-Bitcoin link has become increasingly relevant since 2020.
On the other hand, we have shown that a minimum in stock market volatility often coincides with a maximum in Bitcoin’s price. Conversely, long-term Bitcoin price increases are more frequently positively correlated with rising index volatility. However, at the same time, short-term increases in index volatility can lead to Bitcoin declines. Therefore, Bitcoin does not necessarily protect against “shocks” or “panics.” However, it does benefit from the increasing instability of indices in the long term, which should not be overlooked.
Maximize your Cointribune experience with our "Read to Earn" program! For every article you read, earn points and access exclusive rewards. Sign up now and start earning benefits.

The Cointribune editorial team unites its voices to address topics related to cryptocurrencies, investment, the metaverse, and NFTs, while striving to answer your questions as best as possible.
The views, thoughts, and opinions expressed in this article belong solely to the author, and should not be taken as investment advice. Do your own research before taking any investment decisions.