7% of the time explains 90% of Bitcoin's (BTC) performance
Our study focuses on the role of rare variations in Bitcoin’s (BTC) performance. This exclusive study reveals some astonishing findings. In particular, it appears that 7% of the time explains up to 90% of Bitcoin’s (BTC) performance. This clearly deviates from what one would expect and aligns with the conclusions of our previous article. Our study aims to identify the “rare” variations that explain Bitcoin’s (BTC) performance.
Distribution of Bitcoin’s (BTC) daily variations
We first selected all the daily data for Bitcoin between May 2018 and May 2023, covering a five-year period that is considered sufficiently representative with over 1800 days. We then compiled all these variations based on their range to obtain the following distribution.
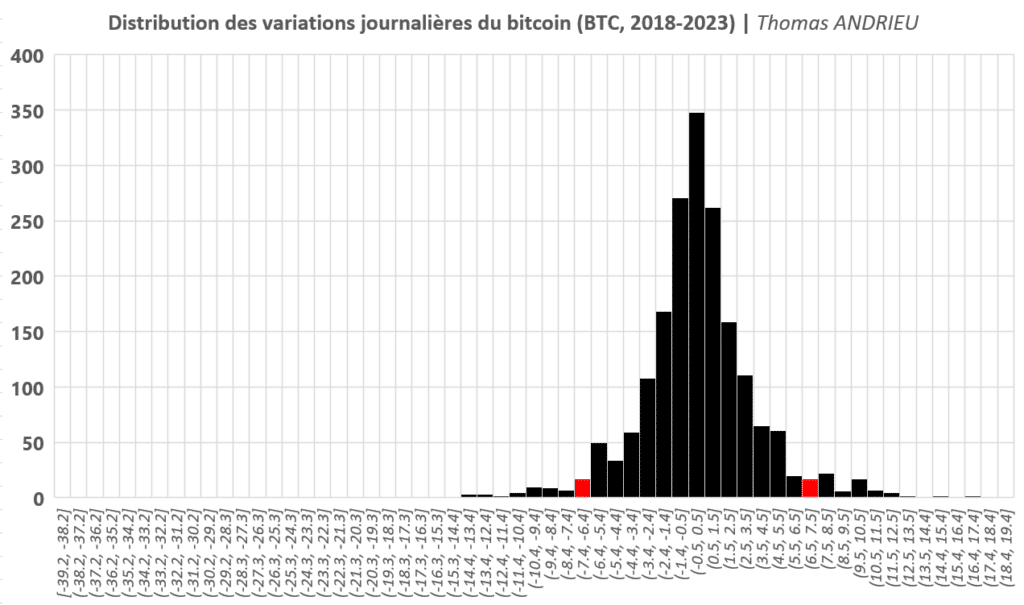
Thus, we can specify that the average daily variation of Bitcoin (BTC) is exactly +0.128%. Additionally, it is intuitively observed that the “extreme” variations, those located at the ends of the bell curve, are disproportionately frequent. The two red bounds represented on the graph indicate the bounds that include a daily variation of +7% (right) or -7% (left). This will be useful for our analysis.
Furthermore, we note that the proportion of bearish days is greater than the proportion of bullish days. Similarly, the share of bearish days is higher than the share of bearish weeks, months, or years in Bitcoin’s (BTC) price. According to another study we conducted in August 2021, “between 2016 and 2021, out of more than 2000 daily variations, the risk of loss was present 63.9% of the time.”
How to measure the significance of extreme variations?
Our study requires a brief explanation of the method used. Based on the over 1800 data points we have, we establish the following steps:
- First, we rewrite all the data while excluding the most extreme data points (beyond the threshold we have set). For example, we replace all variations above 8% and below -8% with zero performance. At the same time, we keep track of the number of days that exceed this threshold.
- Next, we calculate the average of all the daily variations that we have rewritten.
- Finally, we obtain a new average daily performance that can be compared with the overall average daily performance mentioned earlier (+0.128% per day). We also compare the number of “extreme” days to the total number of days (1800).
In other words, we measure the deficit in daily performance caused by the absence of the significant variations we have eliminated. Consequently, this allows us to deduce the induced performance (respectively, the share of absent performance from the initial total performance) by the “extreme” variations.
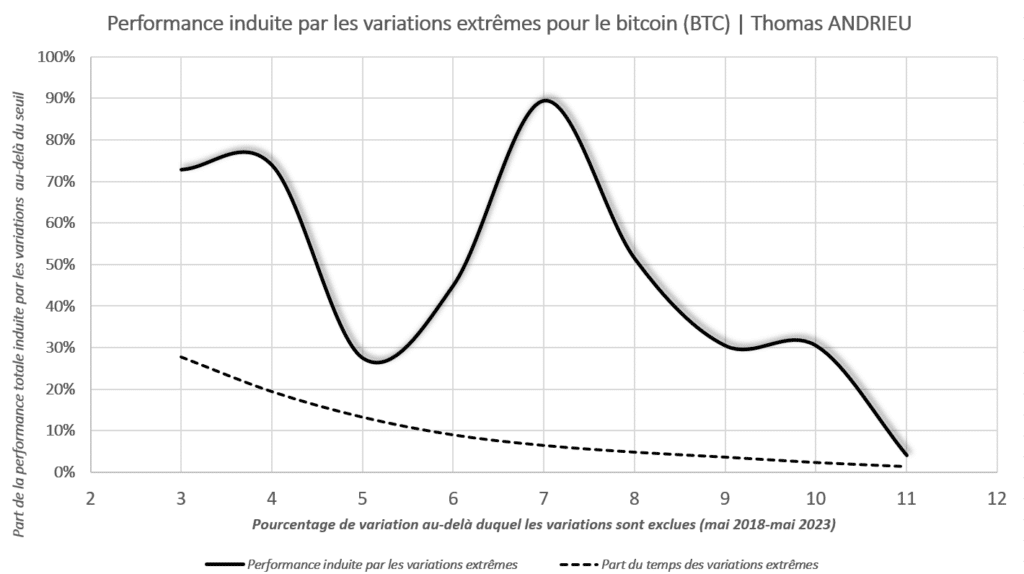
7% of the time explains up to 90% of the performances!
The crux of our work is summarized in the graph below. We separately studied the average daily performance of Bitcoin by excluding variations beyond + / – 3%, then 4%, 5%, and up to 11%… For example, if we exclude variations beyond 3% or below -3%, we can deduce that variations beyond this threshold account for 73% of the entire average daily performance of Bitcoin (BTC). Likewise, we calculated the number of days where the daily variation exceeded + / – 3%. Consequently, it appears that 27.6% of the days have a daily variation greater than 3% or less than -3%.

The graph above shows, in dashed lines, the proportion of time that includes variations beyond (and below) the specified percentage on the x-axis. Thus, over 27% of the time, we observe variations of + / – 3% on Bitcoin (BTC). Additionally, the continuous black curve represents the share of Bitcoin’s performance induced by variations beyond the threshold on the x-axis. The larger the gap between the two curves, the smaller the portion of time that concentrates the majority of the performance.
Key observations
For example, variations above 10% or below -10% account for 2.3% of the time. However, they explain over 30% of Bitcoin’s average daily performance. But the most notable disproportion is seen with extreme variations of + / – 7%. Variations below -7% or beyond +7% represent 6.5% of the time. Yet, they account for nearly 90% of Bitcoin’s average daily performance.
This is visually evident in the distribution graph shown above. Beyond the red threshold on the right, positive “extreme” variations are overrepresented between +7.5% and +8.5%. In other words, a trader who misses most of these daily variations would significantly reduce their average performance. Finally, we observe that extreme variations of + / – 11% have a smaller impact on explaining Bitcoin’s performance.
Insights into Bitcoin’s behavior (BTC)
A paradox seems to arise. Extreme variations at 7% have a greater influence on Bitcoin’s performance than extreme variations at 10%. This means that extreme variations of + / – 10% are less likely to drive the market’s performance and are more often followed by a partial or complete reversal.
In the case of extreme variations at 7%, it implies that variations of this magnitude are less likely to be followed by a reversal movement. The market is more impulsive and less hesitant, realizing most of its reversals and, consequently, its performances during these variations.
The importance of extreme variations
We have previously discussed the significance of extreme variations. It appears that most trend reversals occur around these “extreme” variations. As mentioned earlier, extreme variations of +/- 10% represent 2.3% of the time since 2018. This means that in a year of 365 days, approximately 8 to 9 days will concentrate these variations. In other words, such an “extreme” variation occurs on average every 6 to 7 weeks. It is also worth noting that Bitcoin is a volatile asset, and its behavior strongly depends on the timing of its variations. We have previously written about this topic (fractals): Study of fractals on Bitcoin (BTC) – Cointribune.
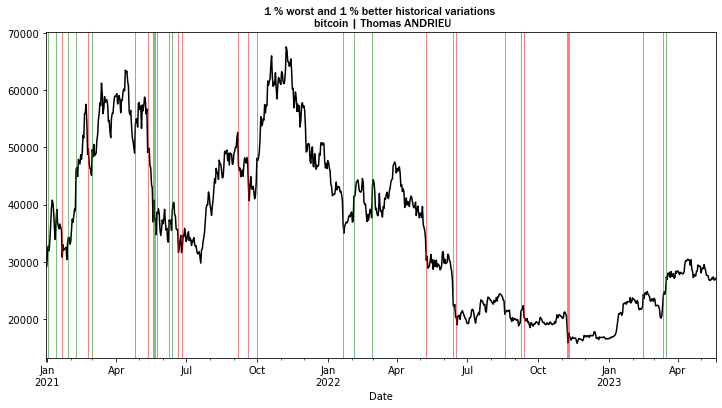
The graph above illustrates with vertical lines the moments when these extreme variations occur. Bullish or bearish reversals are generally driven by such movements. The recurrence of extreme variations reflects a significant shift in investor psychology and often provides insights into the state of the trend. Furthermore, these variations are most commonly frequent around peaks. Indeed, Bitcoin’s volatility is typically higher during bullish trends.
Bad news for short-term trading?
We have seen that a minority of variations, specifically the strongest ones, explain almost all of Bitcoin’s (BTC) performance. This has consequences for how investors and traders approach their strategies. How can one achieve bullish performances when the majority of these performances are concentrated on a few days?
An investor who remains positioned throughout the studied period would benefit from this phenomenon. They would not miss any extreme market variations and therefore not miss out on most of the market’s performances. The risk for traders who engage in numerous trades is to stay on the sidelines during these few days that drive market performance.
However, the conclusions we have drawn can be interpreted differently. A trader who can position themselves during these exceptional days would, theoretically at least, outperform the market. Nevertheless, this hypothesis remains difficult to support as it would require significant anticipation skills. Most traders react to volatility but not necessarily in the right direction and not early enough. It is no surprise that most crypto traders lose in the long term.
Conclusion
Our study has covered an extensive dataset from 2018 to 2023. The analyzed sample clearly demonstrates that a minority of daily variations in Bitcoin (BTC) have a major influence on its overall performance. The most significant figure comes with extreme variations at 7%, i.e., variations below -7% and above +7%. While these variations only represent 7% of the time, they explain up to 90% of the observed performances in Bitcoin’s price (BTC). According to the statistics, we are dealing with an exacerbated “Pareto principle”!
There is a clear overrepresentation of exceptional variations in Bitcoin’s performance. Furthermore, it is important to remember that Bitcoin (BTC) is inherently a volatile asset. Therefore, it was already known that extreme variations played a central and unusually frequent role. But this study confirms that these “exceptional” days clearly have an even greater influence than previously imagined. The impact of an extreme variation is even more significant as it can trigger clear trends without looking back.
In this context, an investor (or trader) who misses most of these “extreme” variations would underperform the market. This observation is also common in most markets and once again highlights the inefficiency of certain traditional models and behaviors in being “in tune” with the market.
Maximize your Cointribune experience with our "Read to Earn" program! For every article you read, earn points and access exclusive rewards. Sign up now and start earning benefits.

The Cointribune editorial team unites its voices to address topics related to cryptocurrencies, investment, the metaverse, and NFTs, while striving to answer your questions as best as possible.
The views, thoughts, and opinions expressed in this article belong solely to the author, and should not be taken as investment advice. Do your own research before taking any investment decisions.