Statistical analysis of Bitcoin (BTC)
In January 2023, our statistical analysis of Bitcoin (BTC) opened up the possibility of a strong bullish recovery in its price.

In our analysis from last January, we also mentioned the hypothesis that the mid-2023 could be another potential risky period. The exit from the bear market has now been confirmed. The bullish recovery was particularly pronounced and exceeded many expectations. Let’s decipher the statistical signals.
An exceptional exit from the bear market
We have already discussed the statistical mechanisms that led to the exit from the bear market. In October 2022, before the FTX incident, the statistical study revealed two things:
- Firstly, that “any sustained further decline in Bitcoin would be relatively unlikely.” Additionally, “BTC volatility would be associated with either a limited new bearish movement or a sustained bullish reversal.”
- Secondly, “any downward movement could either be intense or brief.”
- Furthermore, in January 2023, we could assume that “the probability of witnessing a variation of more or less 10% in the coming weeks is relatively high to date.” This was confirmed by the significant magnitude of the upward surge.
Since autumn 2022, numerous indicators have indicated a likely exhaustion of the bearish trend. Price projections towards $10,000 seemed relatively unlikely to us. The exit from the bear market occurred through an intense but brief decline, which triggered a trend reversal through powerful bullish variations. While statistics have been helpful in interpreting the observed trends, it is also important to decrypt the current situation.
Bitcoin (BTC): Too high, too fast?
The question now is whether the observed rise to $30,000 was premature. To answer this, we turn to several statistical tools.
Reasonable deviation from the moving average
One first fundamental element is provided by the moving average. The 100-day moving average effectively contained the bear market. A breakout from the moving average also well-defined the exit from the bear market. The graph below depicts the price of Bitcoin (BTC) in gray, the 100-day moving average in black, and the deviation between the price and the moving average in blue.
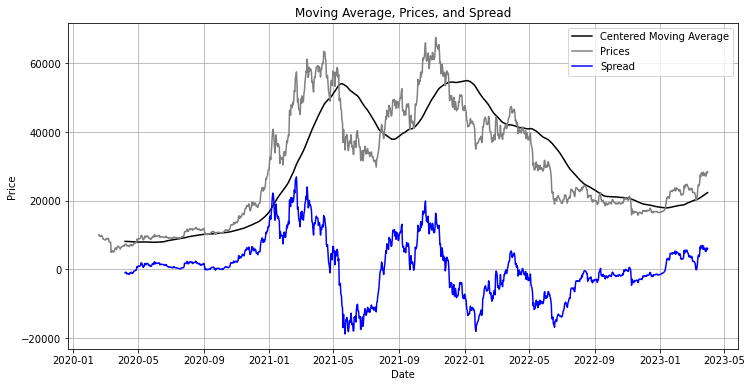
Consequently, it appears that the exit from the bear market occurred gradually between August 2022 and January 2023. A false breakout was recorded in November. The current deviation between the price and the moving average is approximately $5,500. Thus, this deviation is not statistically excessive. During the peak of the bull market in 2020, the deviation from the moving average even reached $20,000. In such a configuration, the current price of Bitcoin would be above $41,000. Therefore, there are currently no excessive price levels.
Statistical strength of the market is waning
One of the major indicators we have to measure market strength is to accumulate daily variations. If the rise is not sharp enough or not sustained enough, the cumulative indicator will show variations that signal weakness. An indicator below 0 indicates a persisting bear market, while an indicator above 0 indicates bullish strength. Moreover, the cumulative variations are usually well-contained (between -40 and 40 for Bitcoin).
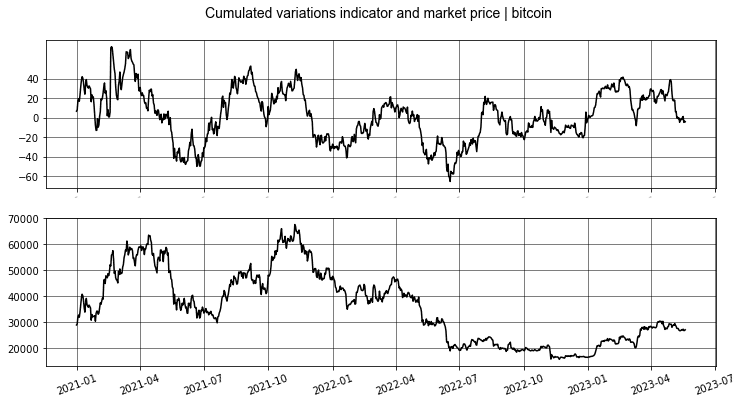
We can clearly observe that the bullish signal was identified as early as January 2023. We specified at that time that it was indeed a positive signal. Now, the price of Bitcoin (BTC) shows significant statistical weakness. Therefore, any further decline (absence of rebound at current levels) would trigger a corrective movement in the following months. This is also reflected technically where the former oblique resistance has become an oblique support (see last section).
Extreme variations could reappear
Bitcoin (BTC) is a volatile asset. The observed trends are generally driven or completed by what we call “extreme variations.” These are variations large enough to reverse investor psychology. Thus, in the graph below, we have represented the price of Bitcoin (BTC) in black. The extreme bullish variations are shown in green, and the extreme bearish variations in red. These extreme variations correspond here to variations that have a (theoretical) probability of 1% of occurring. It is immediately noticeable that these variations are much more frequent than they should be (the graph should display 18 lines if the statistical distribution followed a normal distribution!).
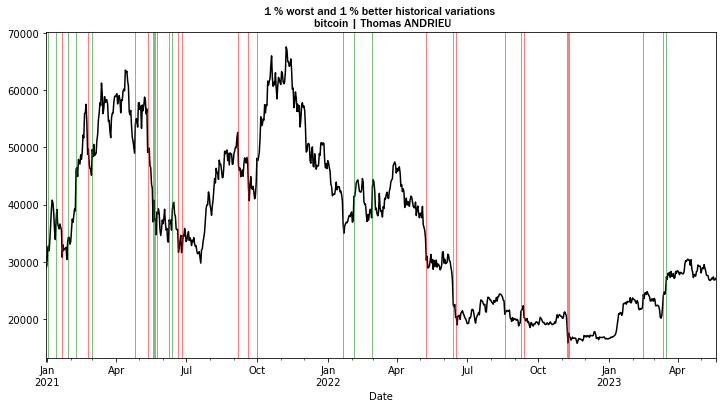
The study of this graph shows that, on average, extreme variations occur in reality every 6 to 7 weeks. Sometimes several months can pass without any extreme variation, which is itself a signal of uncertainty. The last extreme variations recorded date back to mid-March. In this context, it is likely that extreme variations will take effect in the coming weeks. These violent variations that can be expected might potentially drive a trend for the summer of 2023.
Furthermore, the recent extreme variations (green lines on the right of the graph) are clearly bullish and significantly confirm the entry into a new, more bullish market.
Bitcoin (BTC) struggling to outperform indices
We have seen that Bitcoin (BTC) has initiated a bullish process. However, this rebound remains “modest” when compared to the stock market. Bitcoin/Dow Jones ratio is still within a range of 0.6 to 0.7. The rebound of the Dow Jones is less visible since the beginning of the year, but both assets tend to follow a relatively symmetrical evolution. The idea that Bitcoin (BTC) would significantly outperform stocks is not verified in reality.
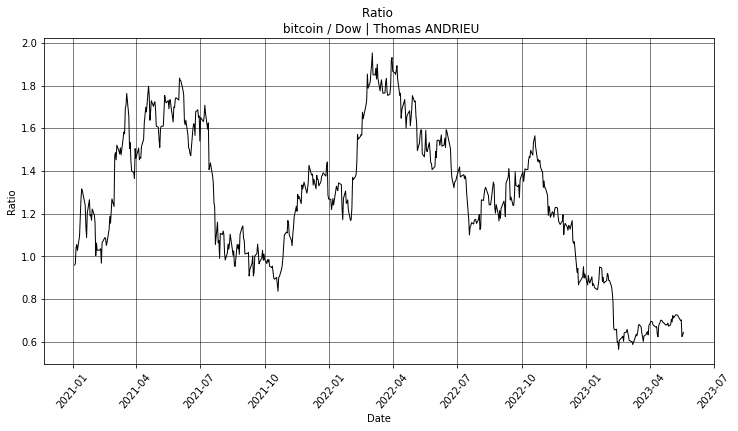
Moreover, as mentioned earlier, the rebound observed in Bitcoin (BTC), although vigorous, is not abnormal. In reality, the low observed in November and December (“rounding bottom”) was “abnormal,” and it was too brief to be durably integrated into the moving average. Therefore, it should be considered that the bullish recovery started from the $20,000 mark. In this case, the recent rebound of Bitcoin (BTC) is not extreme in itself. The study of the ratio confirms this conclusion. It also implies that the upward potential of Bitcoin (BTC) in one year is more significant.
Concordant technical configuration
Finally, statistical analysis can be indirectly visualized through technical analysis. The oblique line on the graph represents the oblique resistance line, which has become an oblique support line, active since September 2022. The break of this oblique line in the short or medium term would target the zone around $21,500. A first major support is also identifiable at around $24,850. In the opposite configuration, the recent stagnation could trigger a bullish movement towards $29,500, then $33,000 and beyond by extension. But as we have mentioned, without sufficient bullish strength, this scenario still appears disadvantaged.
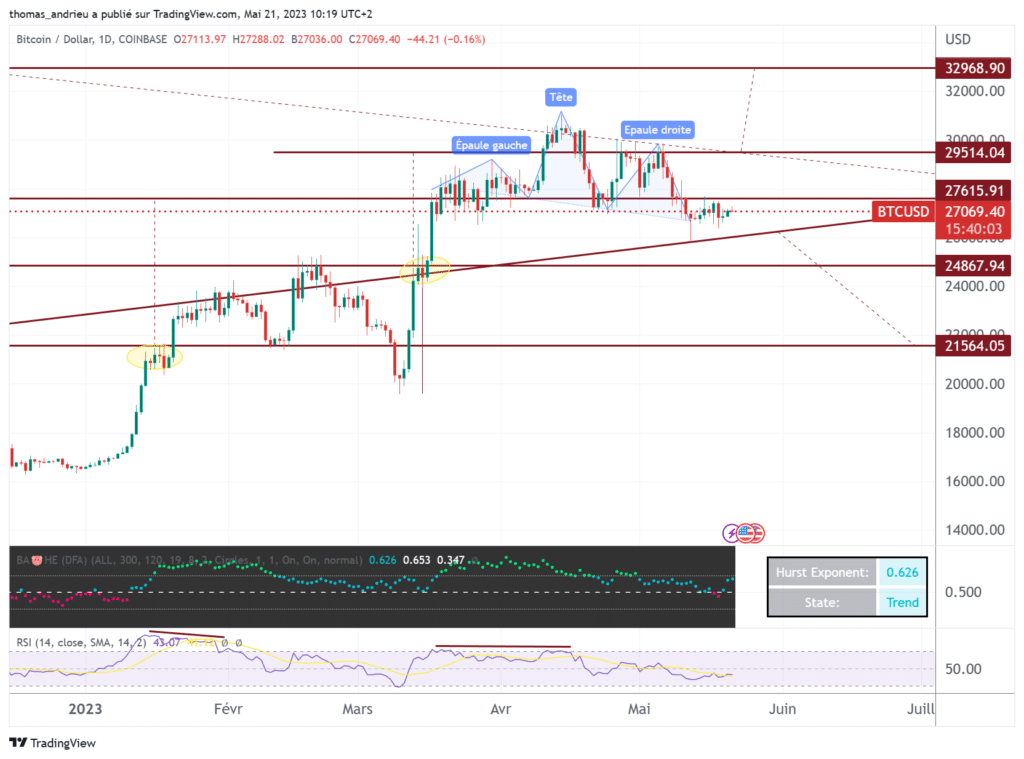
Finally, we note that the upward movement has developed quite cleanly. The first breakthrough (first yellow circle) represents the breakout of the rounding bottom, with a target price of $27,600. The other signal was given by the swing observed around the trendline (second yellow circle), with a price target sending us to $29,500. Following these movements, we can observe the formation of a head and shoulders pattern, relatively imperfect on the first shoulder. Nevertheless, this pattern could confirm either a bearish breakout or, due to its bearish slope, a continuation of the uptrend towards the mentioned thresholds.
Conclusion
In conclusion, the price of Bitcoin (BTC) follows regular statistical mechanics. The recent evolution of Bitcoin’s price confirms the end of the bear market and suggests a more sustainable bullish force. The study of Bitcoin’s statistics reveals three major conclusions.
- Firstly, the rebound initiated since January is not “abnormally strong.” The statistical behavior of Bitcoin (BTC) still allows for maneuvering within the technical movement initiated since January.
- Secondly, the bullish momentum of this rebound is fading. In the absence of sufficiently bullish variations in the coming weeks, a corrective movement becomes increasingly probable. However, a significant rebound in bullish variations would still be a favorable signal for a third wave of growth, although currently less likely.
- Lastly, extreme variations in the coming weeks are quite probable. Since January, these variations have mainly been bullish (representing increases of over 11% in a day). A resurgence of volatility cannot be ruled out by June. This is also useful information as Bitcoin (BTC) often foreshadows volatility in the stock market.
All of this is consistent with the observation that Bitcoin‘s (BTC) rebound has not particularly outperformed that of traditional markets. Finally, technical analysis also supports conclusions similar to our statistical observations. A return below $25,000 would indicate a more sustainable corrective movement, while a breakthrough of $33,000 would obviously be a very bullish signal. The future trend will be determined by the magnitude of the recorded variations (the statistical forces) in the coming weeks.
Maximize your Cointribune experience with our "Read to Earn" program! For every article you read, earn points and access exclusive rewards. Sign up now and start earning benefits.

The Cointribune editorial team unites its voices to address topics related to cryptocurrencies, investment, the metaverse, and NFTs, while striving to answer your questions as best as possible.
The views, thoughts, and opinions expressed in this article belong solely to the author, and should not be taken as investment advice. Do your own research before taking any investment decisions.