Bitcoin (BTC): how to analyse a trading range
The end of this week will mark two months that the price of Bitcoin (BTC) is trendless, sitting in a trading range with quickly-thinning volumes. Only one thing is certain: the exit of the range will be very impulsive. We will use this article to discuss a selection of tools to help you analyse the a phase of this ranging market.

Bitcoin: a stable technical framework for two months
A sideways drift in prices, a crushing of volatility and a thinning daily trading volume; the technical situation of Bitcoin is clear and accepted by all, it is useless to say any more.
But what will be the outcome? The graphical battlefield pits the arguments for the continuation of the correction towards $20,000, the previous all-time high, against the arguments for a resumption of the uptrend that began in January 2019. The next directional movement will be parabolic in nature, technical analysis of the trading range proves this, based on data dating back several weeks (and now several months!).
Bullish vs bearish, how can we predict?
- The trading range on the charts
- The behaviour of the key price indicators
- Changes in trading volume and trader engagement
- Market structure data
This list is not exhaustive, but I will now explain these points for you:
The charts: think about thecurrent shape of the range that Bitcoin is forming. A falling wedge (bullish reversal), a flag (bearish continuation), a huge head and shoulders (bearish)? Everyone is influenced by their emotional biases, so nothing is clear, and there is no obvious structure.
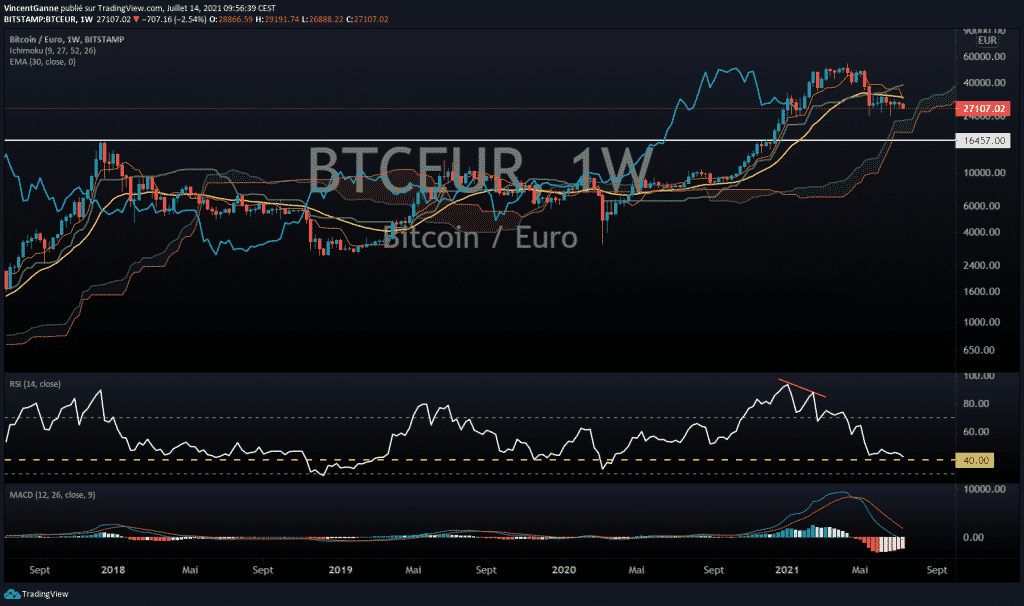
Averages and indicators: price action aside, averages can sometimes mark the exit from the range. The divergences and signals specific to these indicators make it possible to detect what is coming in advance. A kind of bullish divergence can be seen in daily data on the RSI and the MACD, but seen as we are under 50 (for the RSI) and below 0 (on the MACD), we do not look bullish.
Trading volume: trading volume data (especially those of pro traders) can indicate at an early stage the next movement. Accumulation or distribution: these are two terms for two opposite outcomes. and currently, the real exposure of institutional investors does not reflect a massive bullish accumulation on support, even if some funds are shouting from the rooftops about their buying strategy in the current zone. But others still seem to be waiting for the previous ATH. In short, nothing is really clear on this front. On this note, the open interest on the Bitcoin options/futures market and the dynamics of the Grayscale Bitcoin Trust fund are useful barometers.
Market structure: in the month of June, the audience of crypto exchanges dropped by 30% on average, with a mass of retail traders jumping ship. On the other hand, the number of active Bitcoin addresses, admittedly declining, is still on course with its two-year upward trend. At the moment, the overall commitment is higher than it was a year ago.
In conclusion, it is impossible to predict the direction of exit from the range, but let’s still admit that without a massive bullish uptick in volume, the correction is likely to continue.
Maximize your Cointribune experience with our "Read to Earn" program! For every article you read, earn points and access exclusive rewards. Sign up now and start earning benefits.

Stratégiste de marché, analyste technique, formateur, intervenant régulier sur BFM Business et différents médias économiques et financiers ; je me sers de mes connaissances des marchés financiers, de la macro et micro économie dans le but de prévoir les tendances de moyen et long terme des actifs financiers.
The views, thoughts, and opinions expressed in this article belong solely to the author, and should not be taken as investment advice. Do your own research before taking any investment decisions.