It feels like 2021 again. Cardano is one of the best performers among blue chip coins, and the 10th largest cryptocurrency by market cap has surged 29% in just seven days, reaching $0.747 at the time of writing. In the past 24 hours alone, it added nearly 4%, driven by a wave of bullish momentum across the altcoin market.
Technical Indicators
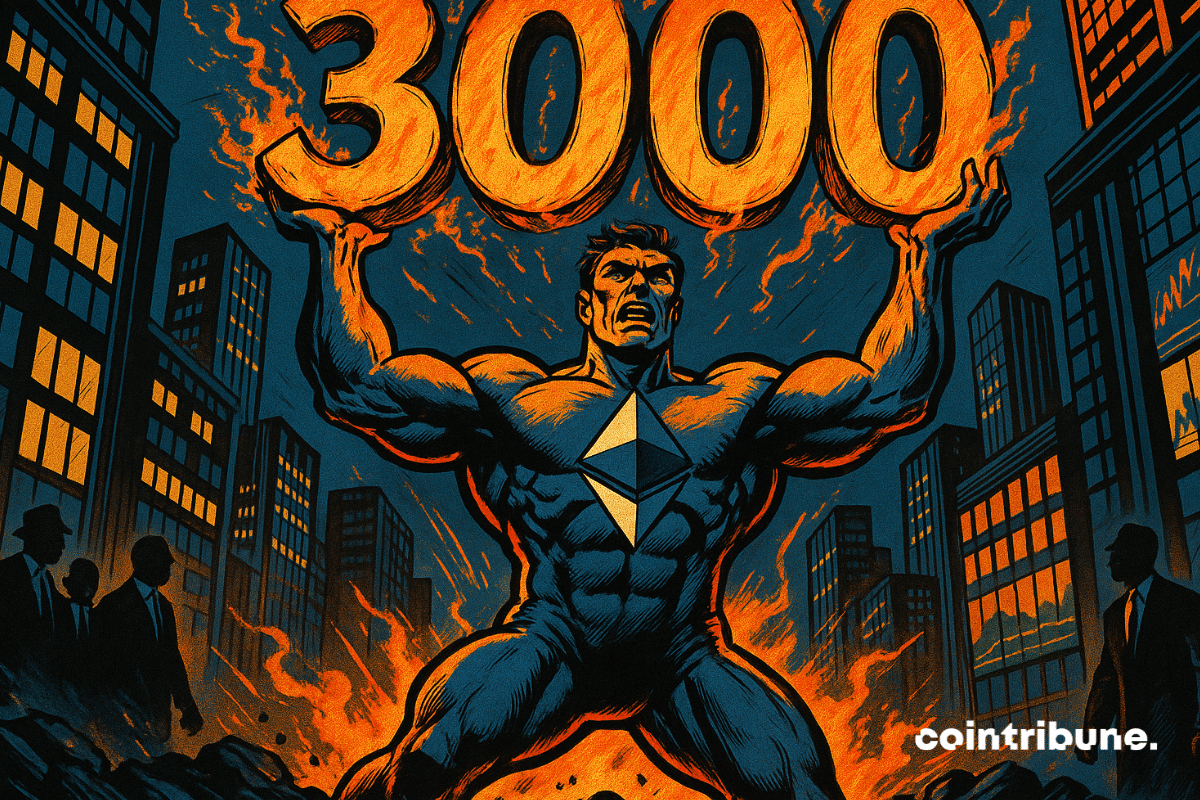
Ethereum has climbed back to $3,000, driven by rising institutional purchases and increased futures market activity, signaling renewed bullish momentum.
Crypto explosion on the horizon or market mirage? The Bitcoin Macro Index reveals a worrying divergence. Details here!
Despite a 14% drop, the AVAX crypto shows an increase in trading volume and accumulation of investors. Detailed analysis!
The movements of Bitcoin rhythm the markets, between phases of euphoria and brutal corrections. After a record of 108,268 dollars in December 2024, the crypto is undergoing a period of consolidation. However, a major technical indicator, the 52-week Simple Moving Average (SMA), fuels speculation. According to analyst Dave the Wave, Bitcoin could reach a new peak by July 2025, a pattern already observed during previous bullish cycles. Thus, if this prediction is validated, it would mark a key milestone in the current cycle. Nevertheless, the market's evolution remains uncertain, between technical signals and external factors likely to influence price trajectories.
In the complex world of trading, understanding and analyzing market trends are essential for success. Among the various tools of technical analysis, the Hurst cycle stands out for its ability to predict market movements based on historical trends. This article explores in detail the Hurst cycle, starting with its fundamental principle, its advantages, and its practical application in trading.
Trading on financial markets requires precise analysis and a deep understanding of market trends. Technical indicators are essential tools in this process. They provide key information to guide trading decisions. However, with the multitude of indicators available, it can be difficult for traders to choose those that best suit their needs and strategies. This article offers a clear guide on the most popular technical indicators, their selection, and optimal usage.
In the world of trading, moving averages stand out as prominent technical indicators. They allow traders to analyze short-term price fluctuations, providing a clearer view of market dynamics. However, their use requires a deep understanding and prudent interpretation. This article explores the fundamentals of moving averages, their different types, their limitations and pitfalls, as well as practical tips for their use.
In the dynamic world of trading, technical indicators play a crucial role in traders' decision-making. Among these tools, the Relative Strength Index (RSI) stands out for its versatility and effectiveness. This indicator helps assess the strength of market trends and identify potential reversal points. However, despite its popularity, the RSI presents challenges and limitations that traders must understand to use it effectively. This article explores the RSI in detail, from its functioning to its practical application, while highlighting the precautions to take to optimize its use in trading strategies.
Bollinger bands are a technical analysis tool that provides essential insights into volatility and price trends in financial markets. However, this widely recognized indicator requires a deep understanding to be used effectively. Overview of the specifics of Bollinger bands.
The MACD is a leading technical indicator in the trading field. Used to analyze market trends, it helps traders make informed decisions based on price movements. However, despite its popularity, the MACD can sometimes be misunderstood or misused, raising questions about its interpretation and practical application. This article explores the MACD in detail, from how it works to its use in trading, including its advantages and limitations.
As the price of Bitcoin reaches historic highs, having nearly touched 77,000 dollars yesterday, Friday, November 8, 2024, investors are faced with a critical question: is this rapid rise supported by real value, or is the market already hitting its limits? In a price discovery phase where traditional benchmarks seem to dissolve, analyses on on-chain metrics allow for a better understanding of the underlying potential of the most emblematic cryptocurrency. Five key indicators show that, despite this peak, Bitcoin remains fundamentally undervalued.
After a prolonged phase of consolidation, notable movements seem ready to manifest themselves in the price of BTC. The Hash Ribbon indicator is currently displaying a buy signal, marking the end of the bitcoin (BTC) miners' capitulation. Could this be the catalyst for the next bull market?
While Litecoin's Halving is generating interest this week, the flagship cryptocurrency, BTC, is showing a bullish configuration. One renowned trader claims that a rise towards $52k is inevitable for bitcoin (BTC), based on the SSA (Senko Span A), a component of the Ichimoku indicator.
Binance étant au cœur des polémiques liées aux attaques du régulateur Américain, le cours du Binance coin (BNB) en a littéralement payé les frais.


