How to Perform Technical Analysis in Trading?
Technical analysis is a fundamental component of trading, allowing investors to navigate the financial markets insightfully. It is based on studying price movements and trading volumes to predict future trends. This article aims to demystify technical analysis by explaining its basic principles, essential tools and indicators, how to read and interpret charts, as well as effective strategies to adopt.

Fundamentals of Technical Analysis
Technical analysis is an indispensable method for investors and traders seeking to predict future price trends in financial markets. Unlike fundamental analysis, which focuses on the intrinsic value of a stock, technical analysis is based on studying price movements and market volumes. It relies on the idea that stock prices reflect all available information and that these prices move in identifiable trends.
Key Tools and Indicators
In the world of trading, technical analysis relies on a variety of tools and indicators that help investors decipher market movements and anticipate future price trends of stocks. These tools are essential for analyzing stock charts and making informed decisions.
Types of Charts
Charts are the cornerstone of technical analysis, offering a visual representation of price movements and trading volumes over a given period. Each type of chart provides unique and essential information for understanding market trends. Line charts are the simplest, plotting the closing price of a stock over a period. Although it provides a clean view, it may lack crucial details on intraday fluctuations. In contrast, bar charts provide more information, showing the open, close, high, and low of each period. This wealth of information allows traders to better grasp market volatility and dynamics.
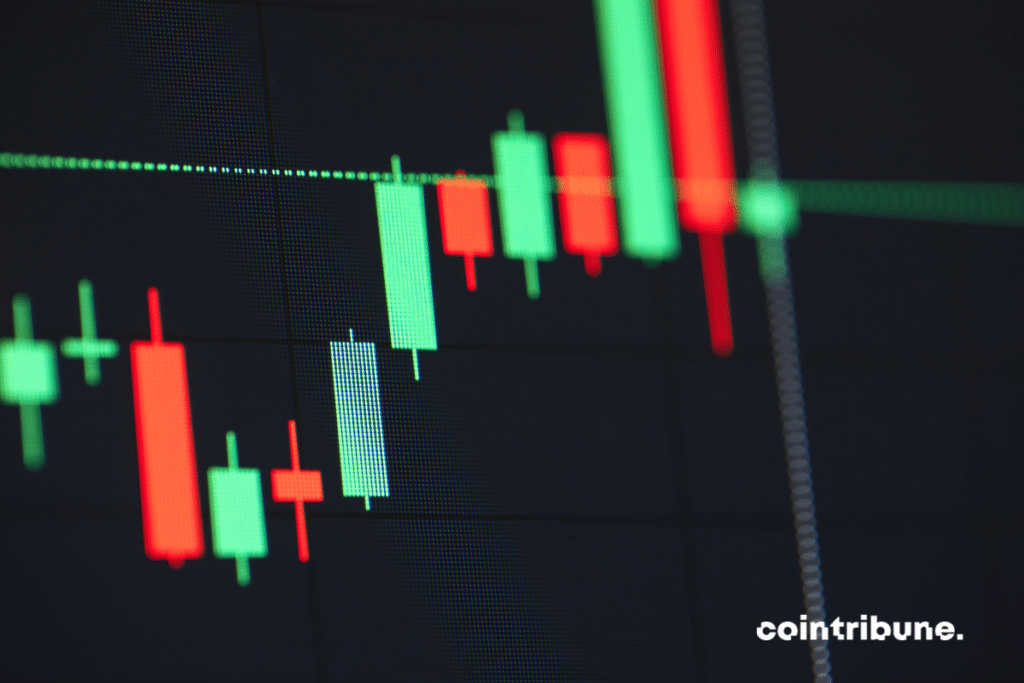
Japanese candlestick charts, highly favored by traders, offer even more detailed analysis. Each candlestick indicates not only the same information as bar charts but its color (often red for a decline and green for an increase) makes trend interpretation more intuitive. These charts are particularly useful for identifying trend reversal patterns, such as hammer or shooting star configurations.
Technical Indicators
Technical indicators are mathematical tools applied to charts to help predict future price movements. They are essential for complementing visual analysis of charts and providing trading signals. Moving averages are one of the most commonly used indicators. They smooth out short-term price fluctuations, allowing for a clearer trend to emerge. Traders often observe the crossings of different moving averages (for example, a 50-day moving average crossing a 200-day moving average) to identify potential trend changes.
The Relative Strength Index (RSI) is another key indicator, measuring the speed and change of price movements. It helps identify overbought or oversold conditions, providing signals for potential trend reversals. An RSI above 70 often indicates overbought conditions, while an RSI below 30 suggests oversold conditions.
The Moving Average Convergence Divergence (MACD) is also widely used. This indicator tracks the relationship between two moving averages and is particularly useful for identifying the strength, direction, momentum, and duration of a trend.
Chart Patterns
Chart patterns are visual formations on charts, and their identification is crucial for predicting future price movements. These patterns help traders understand market psychology and anticipate turning points.
Continuation patterns, such as flags and pennants, indicate that the current trend is likely to continue after a brief pause. These patterns are particularly useful in a strongly trending market, offering entry opportunities for traders looking to join the trend.
Reversal patterns, such as head and shoulders or double tops and bottoms, signal a potential change in trend. Recognizing these patterns can be crucial for traders seeking to anticipate a trend reversal and adjust their positions accordingly.
How to Read and Interpret Charts?
The ability to read and interpret charts is fundamental in trading. These charts are not just representations of price movements but windows into market psychology. They provide crucial clues about what investors think and how they might act.
Identifying Trends
The first step in analyzing a chart is to identify the overall trend of the market. A trend can be bullish, bearish, or sideways. In a bullish trend, prices rise gradually, forming higher highs and higher lows. This indicates increasing optimism among investors and a potential continuation of price increases.
Conversely, a bearish trend is characterized by declining prices, with lower highs and lower lows. This reflects negative sentiment in the market and may signal a continuation of price declines. Sideways trends, where prices fluctuate within a narrow range, indicate uncertainty and a balance between supply and demand. Recognizing these trends is crucial as they form the basis of many trading decisions. Traders often seek to “follow the trend,” buying in an uptrend and selling in a downtrend.
Support and Resistance Levels
Support and resistance levels are key concepts in technical analysis. A support level is a price below which it is difficult for the market to fall. This represents a point where demand is strong enough to halt price declines. Conversely, a resistance level is a price above which it is difficult for the market to rise, indicating a point where supply exceeds demand. These levels are identified by drawing horizontal lines at points where prices have bounced repeatedly. Breaking through a support or resistance level can signal a significant change in market dynamics and is often used by traders to make entry or exit decisions.
Reversal and Continuation Patterns
Reversal and continuation patterns are visual formations on charts that help traders anticipate future price movements. Reversal patterns, such as head and shoulders or double tops, signal a potential change in the market’s direction. For example, a head and shoulders formation often indicates the end of an uptrend and the beginning of a downtrend.
Continuation patterns, such as triangles or flags, suggest that the current trend will continue. These formations typically occur during a pause in a well-established trend and are followed by a resumption of that trend.
The ability to identify and interpret these patterns is essential for traders. It allows them to better understand market dynamics and make more informed trading decisions. By combining trend analysis, support and resistance levels, and chart patterns, traders can develop a deeper understanding of market movements and act accordingly.
Technical Analysis Strategies
Technical analysis, with its numerous tools and indicators, offers a variety of strategies for traders looking to navigate the stock markets. These strategies, ranging from simple to complex, enable investors to make informed decisions based on price movements and market trends.
Beginner Strategies
For beginner traders, it is advisable to start with simple yet effective technical analysis strategies. A popular approach is the use of moving averages, which help smooth out short-term price fluctuations and identify trends. For example, a trader may buy a stock when its price crosses above its moving average and sell when the price crosses below. Another basic strategy is breakout trading, where traders enter the market when a stock price breaks through a key resistance level, potentially indicating the start of a new uptrend. Conversely, a breakout below a support level may signal a new downtrend.
These strategies, while simple, require an understanding of basic technical analysis concepts such as trends, support and resistance levels, and the ability to read charts effectively.
Advanced Strategies
More experienced traders can explore more advanced technical analysis strategies. These strategies often involve the simultaneous use of multiple indicators and chart patterns to identify trading opportunities. For example, combining the Moving Average Convergence Divergence (MACD) and the Relative Strength Index (RSI) can provide more precise trading signals. The MACD helps identify trend changes and momentum, while the RSI can indicate whether a stock is overbought or oversold.
Another advanced strategy is the analysis of chart patterns, such as head and shoulders or triangles, which can signal major trend reversals in the market. These patterns require careful analysis and a good understanding of market psychology.
Risk Management
Regardless of the chosen strategy, risk management is a crucial aspect of technical analysis. This involves setting stop-loss orders to limit potential losses and taking profits at predetermined levels to secure gains. Good risk management also involves not investing more than one can afford to lose and diversifying one’s portfolio to reduce exposure to risk. Additionally, it is important to stay informed about market events that may influence stock prices, such as economic announcements or changes in monetary policy.
Conclusion
Technical analysis proves to be a crucial aspect of trading, providing investors with the necessary tools to decipher market trends and movements. By mastering chart reading, interpreting indicators, and applying suitable strategies, traders can significantly improve their decision-making. However, it is paramount to always integrate a risk management strategy to protect one’s capital. Thus, with a balanced and informed approach, technical analysis becomes an essential lever for success in the trading universe.
Maximize your Cointribune experience with our "Read to Earn" program! For every article you read, earn points and access exclusive rewards. Sign up now and start earning benefits.

The Cointribune editorial team unites its voices to address topics related to cryptocurrencies, investment, the metaverse, and NFTs, while striving to answer your questions as best as possible.
The views, thoughts, and opinions expressed in this article belong solely to the author, and should not be taken as investment advice. Do your own research before taking any investment decisions.