Crypto: Polygon about to catch up? Technical Analysis
Polygon bounces back for a second time from its support, indicating a bullish recovery in its price. Let’s examine the future prospects of the MATIC price together.

Polygon cryptocurrency situation (MATIC)
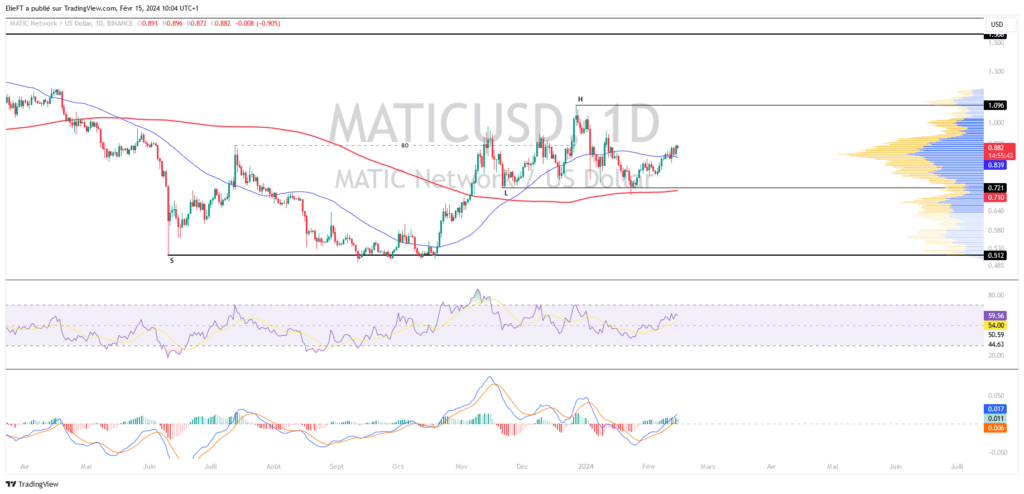
Polygon has experienced a downturn, which seems to have ended after its price rebounded from the support level at $0.50. Indeed, it was from this level that the price of MATIC began to rise, exceeding its previous peak. Following this development, the cryptocurrency’s price found new support at $0.70, enabling it to reach a new high, just above the psychological threshold of $1. Unfortunately, this last bullish movement was completely erased. The Polygon token thus had to test buyer interest again at the $0.70 support level.
Today, MATIC is trading at around $0.88. It seems that the cryptocurrency has recently experienced a resurgence of interest from buyers. It is noteworthy that MATIC has recently bounced off its 200-day moving average and is currently above its 50-day moving average, suggesting an upward trend. However, the fact that these moving averages are horizontal also indicates a period of uncertainty. As for the oscillators, they have rebounded above the median level, signaling a recovery of the bullish momentum.
The current technical analysis has been carried out in collaboration with Elie FT, a passionate investor and trader in the cryptocurrency market. He is currently a trainer at Family Trading, a community of thousands of proprietary traders active since 2017. There you will find Live sessions, educational content, and support around financial markets in a professional and welcoming atmosphere.
Focus on derivatives (MATIC/USDT)
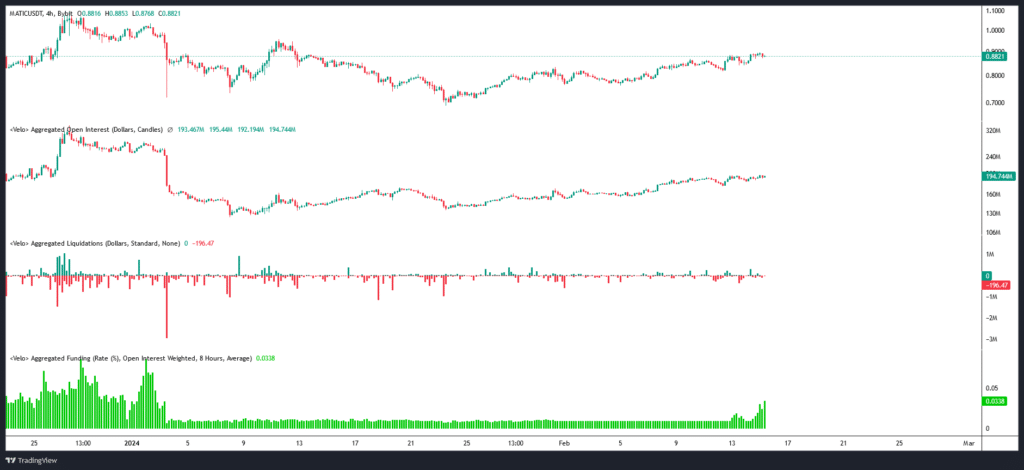
It can be observed that the open interest in the MATIC/USDT perpetual contracts has increased at the same pace as its price, accompanied by a slightly positive funding rate. This simultaneous increase suggests that traders’ speculative interest is mainly oriented towards buying. Regarding liquidations, they do not seem particularly significant, although it is worth noting that they are predominantly on the buying side. This could indicate an excess of optimism among these buyers.
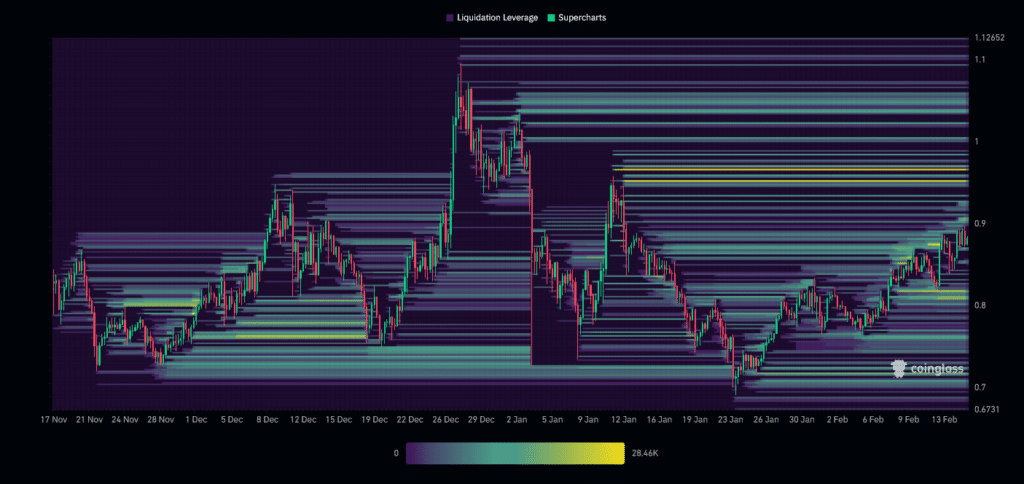
The liquidation heat map for MATIC over the last three months shows that the $0.87 barrier has been breached. Currently, two key zones around MATIC can be identified. Below it, the support zone is located around $0.81. Above it, the resistance zone ranges from $0.95 to $0.97. As the market approaches this level, we could witness a massive trigger of orders, potentially increasing the cryptocurrency’s volatility. This zone thus represents a significant point of interest for investors.
The hypotheses for Polygon (MATIC) price
If the MATIC price fails to stay above $0.72, we could anticipate a continuation to the $1 threshold. The next resistance to consider, should the upward movement continue, would be its last peak at $1.1 – $1.2, and possibly higher if buying interest continues to dominate. At this stage, that would represent close to a +37% increase.
If the MATIC price cannot maintain itself above $0.72, we could envision buyer support at the $0.67 zone. The next level to consider, should the downward trend continue, would be around $0.5. At this stage, it would represent a decrease of nearly -40%.
Conclusion
The cryptocurrency associated with Polygon seems to be experiencing a renewed interest from buyers after a period of decline. However, since it is currently in a consolidation phase, this raises questions about the future performance of MATIC. Therefore, it will be crucial to closely observe the price’s reaction to various key levels to confirm or refute the current hypotheses. It is also important to remain cautious about potential « fake outs » and market « squeezes » in each scenario. Finally, let’s remember that these analyses are based solely on technical criteria and that cryptocurrency prices can also move rapidly based on other more fundamental factors.
Maximisez votre expérience Cointribune avec notre programme 'Read to Earn' ! Pour chaque article que vous lisez, gagnez des points et accédez à des récompenses exclusives. Inscrivez-vous dès maintenant et commencez à cumuler des avantages.

Family Trading est une Communauté de traders a compte propre active depuis 2017 offrant Lives, contenus éducatifs et entraides autour des marchés financiers dont celui des cryptomonnaies avec à ses côtés Elie FT, investisseur et trader de passion sur le marché crypto.
Les propos et opinions exprimés dans cet article n'engagent que leur auteur, et ne doivent pas être considérés comme des conseils en investissement. Effectuez vos propres recherches avant toute décision d'investissement.